.svg)


NetSuite Investment Management: IFRS 9 Accounting on One Ledger
It's the Sunday before the board meeting, and the portfolio return is wrong.
Not wrong, exactly — that's the maddening part. The register footer prints one IRR. Page two of the same pack prints another. The schedule of investments your administrator sent has a third. Every figure is defensible. Every figure came from somewhere real. And in about eighteen hours, a family board member is going to point at two of them and ask, quite reasonably, which one is true.
You already know how this goes. Someone opens the master spreadsheet. Someone else pulls the custodian file. By midnight you've reconciled the gap to the rial and you can explain it — a dividend booked twice, a valuation that moved between exports, a listed position that IPO'd and never got reclassified. You'll walk into the room with an answer. But you'll also walk in knowing the truth: the numbers didn't disagree because anyone made a mistake. They disagreed because the same fact lives in four different places, and nothing joins them up.
That's not a reporting problem. It's an architecture problem. And it's the specific thing a NetSuite-native investment portfolio management solution is built to end.
The Short Answer
Investment portfolio management on NetSuite runs on one principle: a single ledger, where each holding is classified once and every number downstream follows from that decision.
Classify → Account → Value → Report. One decision, and everything downstream follows from it.
Three things make it unlike the reporting stack most investment teams live with today. Every holding is classified under IFRS 9 before it is accounted for, and that classification — not the ownership percentage — decides its treatment for life. Every subsequent event posts its own journal entry automatically, so month-end is largely already done. And every figure on every screen traces back to the same ledger, so the four-numbers-for-one-portfolio problem simply cannot arise.
Methodology note. This article describes investment portfolio management as delivered on Oracle NetSuite, drawing on Azdan's implementation work with investment companies, family offices, and holding groups across the UAE, Saudi Arabia, and Egypt. Where a point reflects delivery experience rather than a documented product feature, it is labeled as a recommendation.
The Portfolio That Finally Sits in One Place
Most investment teams don't lack data. They drown in it. Private equity NAVs from one fund manager, listed holdings from another, sukuk positions off the custodian statement, real estate valuations from a third party, cash and murabaha off the bank feed — each arriving on its own schedule, in its own format, measured its own way under IFRS 9. The portfolio exists, but only as an act of monthly reassembly performed by whoever is best at Excel.
Picture the alternative: every one of those holdings living on a single record, in one ledger, at the level you actually think about them. Public equities down to the individual security. Private equity down to the underlying portfolio company, with vintage and capital account intact. Fixed income with its maturity and yield profile. Real estate down to the property and the tenant. Not five systems politely integrated — one system, where “the portfolio” is a place you can open rather than a file you have to build.
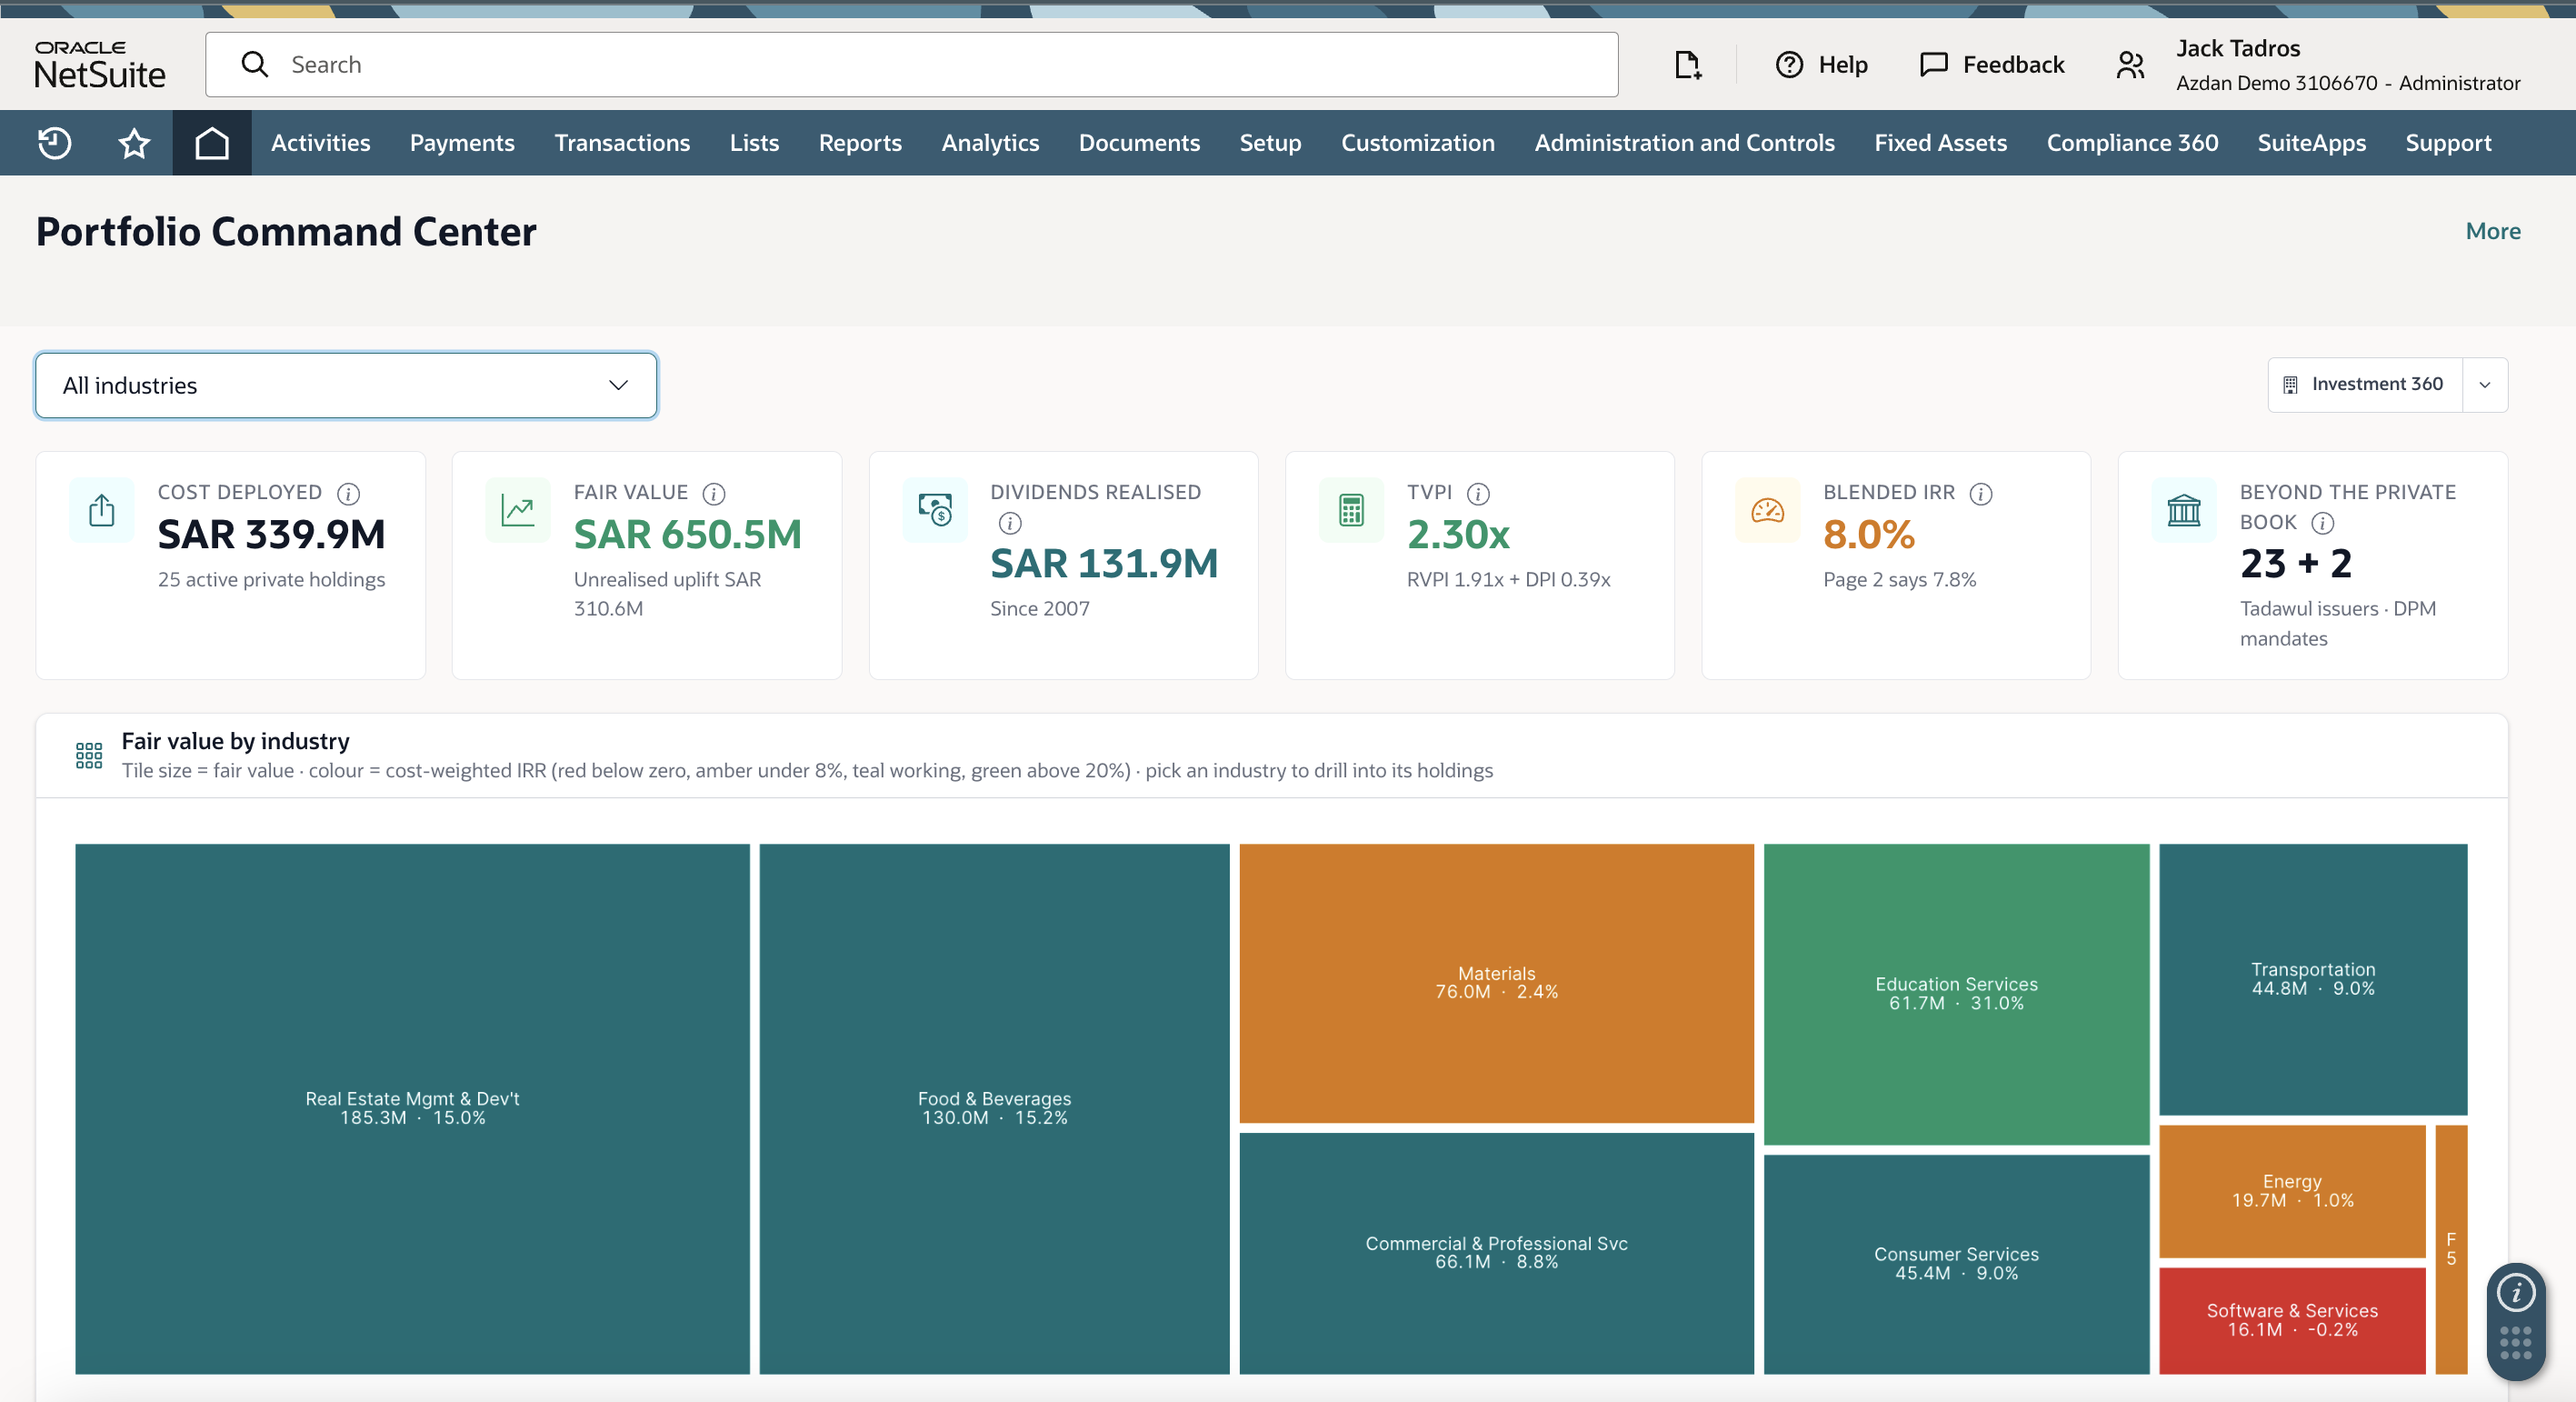
When you open it, you don't get a static export. You get a command center that's alive: cost deployed, fair value, dividends realized, TVPI, blended IRR — every figure re-derivable, not frozen in a PDF someone ran last Thursday. The treemap sizes each industry by what it's worth and colors it by what it returned, so the flattering headline can't hide the position that's quietly gone sideways. Slide the as-of date back a year and the entire page rebuilds itself. It isn't a screenshot of your portfolio. It's a model of it.
The Question That Decides Everything, Asked Once
Here's what the spreadsheets never really settle: how much power do you actually have over each holding? Because that single question — not the ownership percentage, not the arithmetic — decides how a holding is treated for the rest of its life.
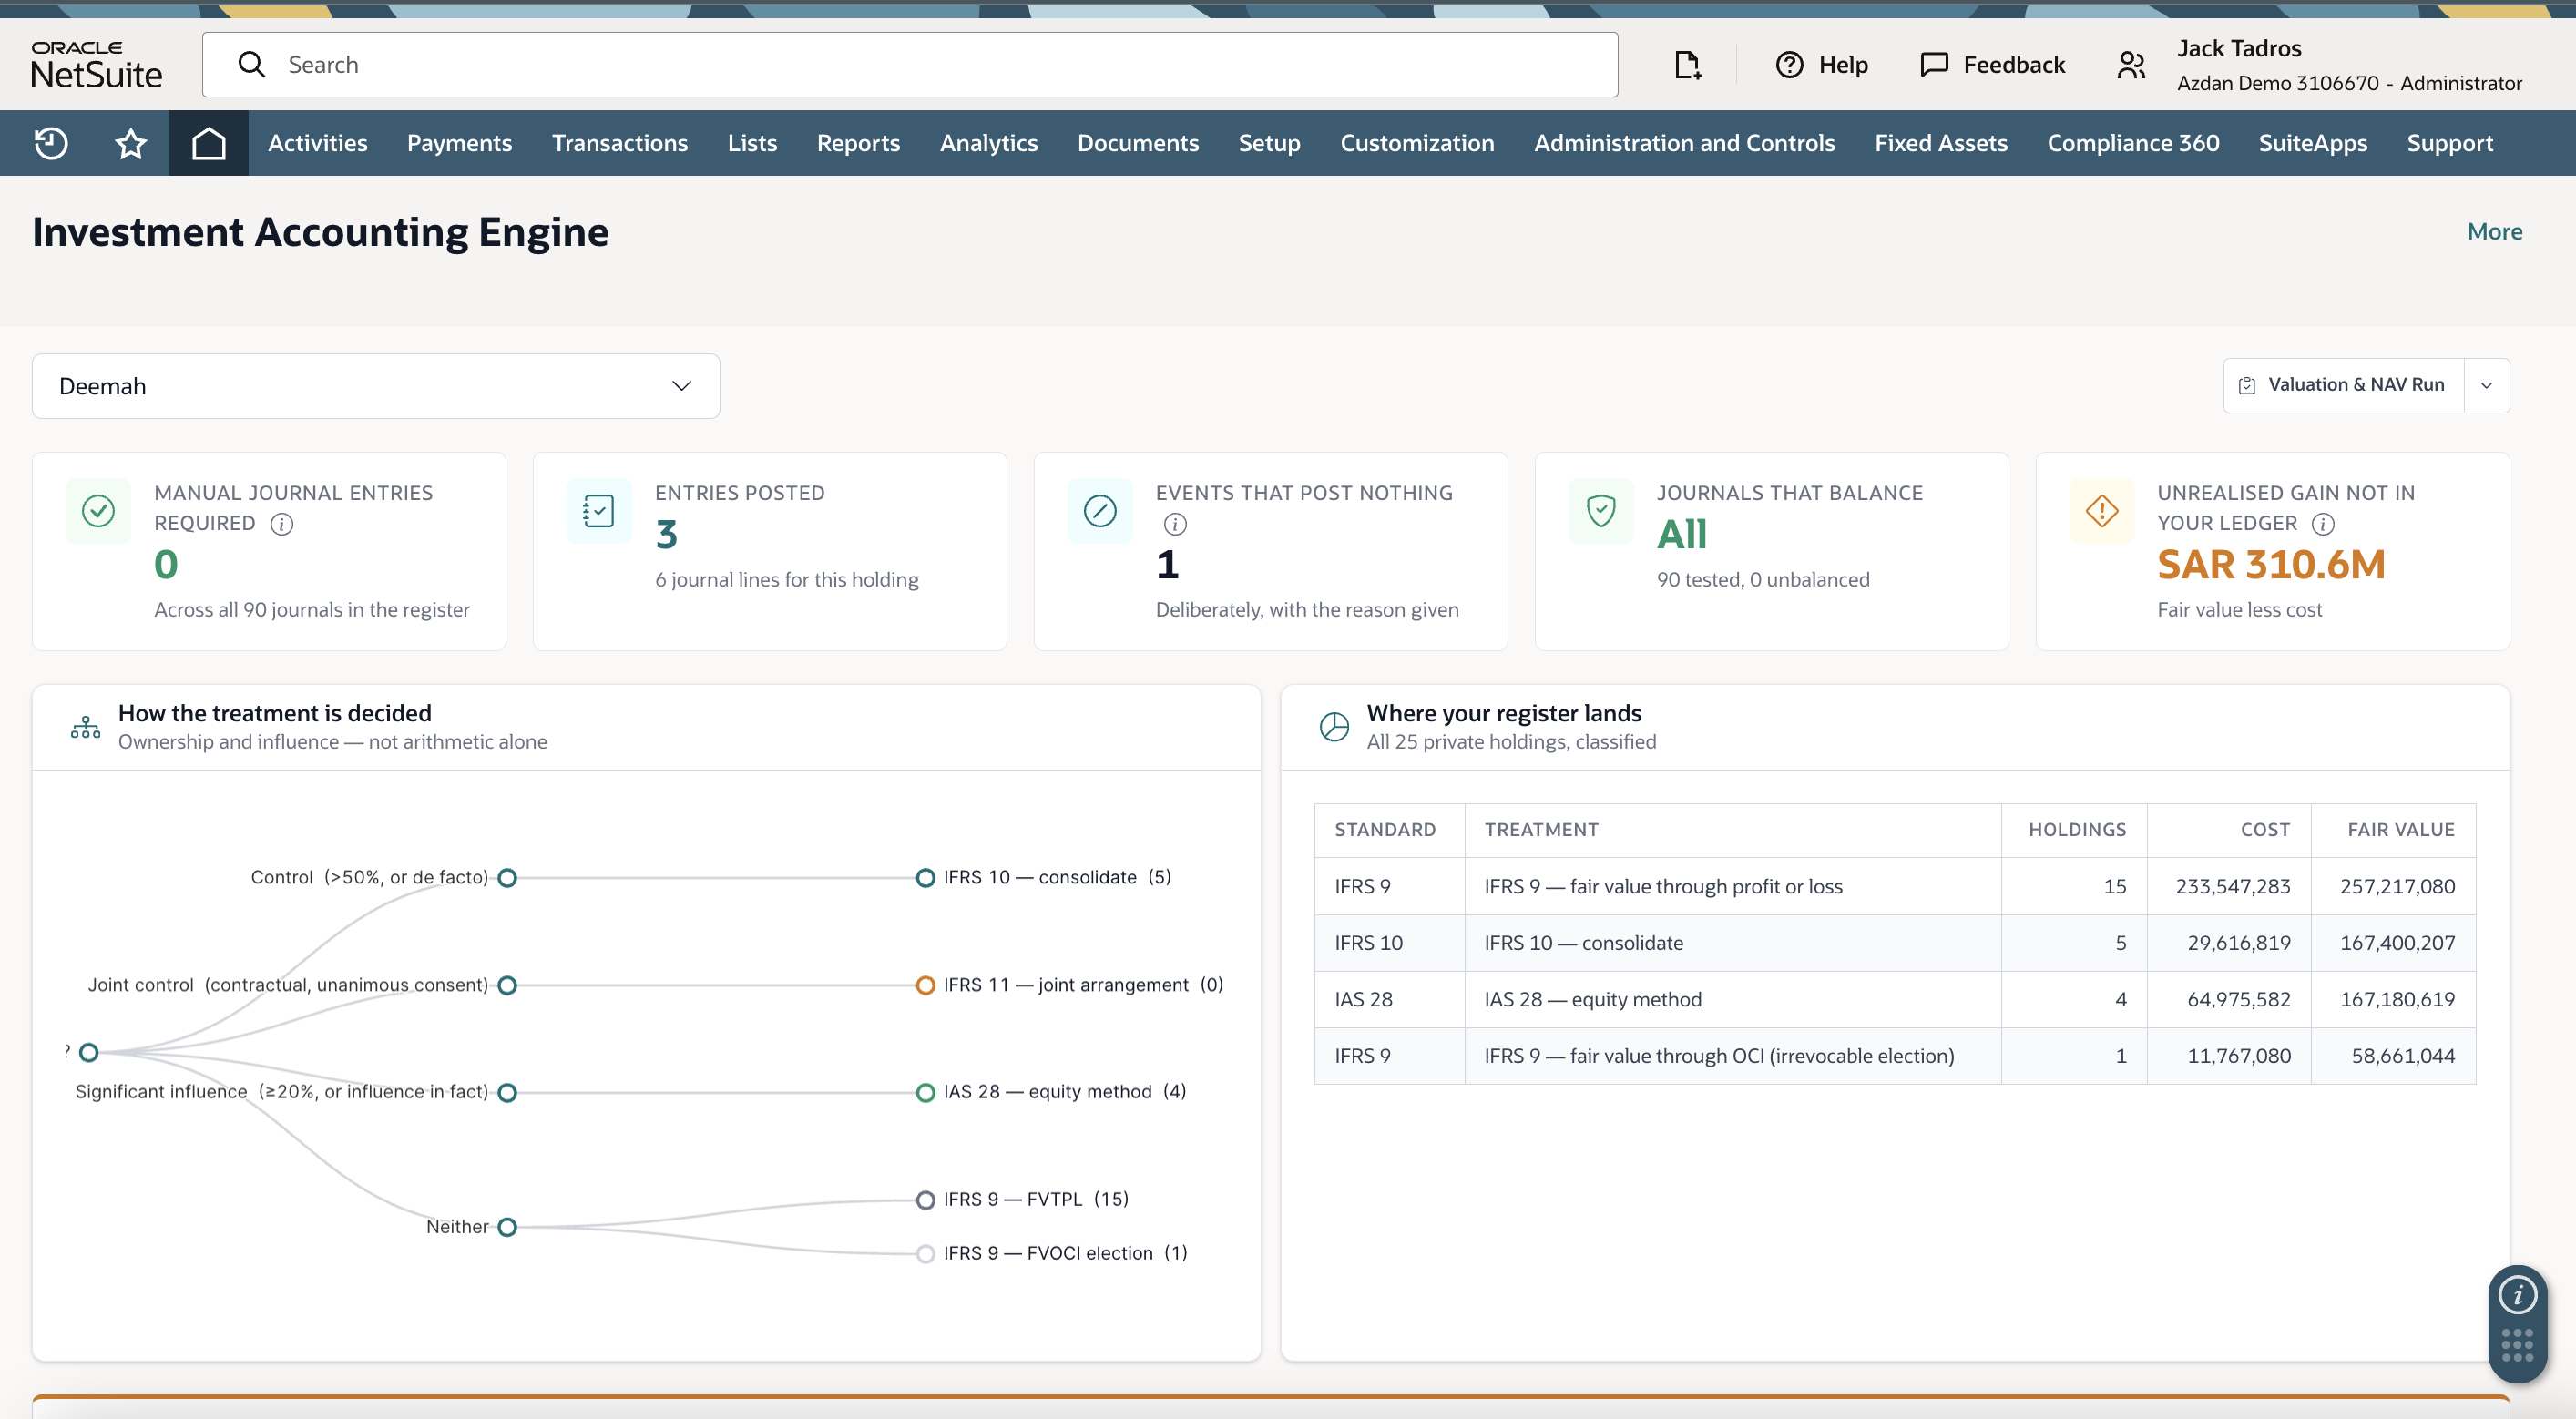
A NetSuite investment solution asks it up front and lets the answer cascade. Classify a holding under IFRS 9 and everything downstream falls into place:
- FVTPL — Fair Value Through Profit & Loss. Trading equities, derivatives, most private equity. Gains flow straight to the P&L.
- FVOCI — No Recycling. Strategic equity stakes held long-term. Uplift parked in an equity reserve; irrevocable election at initial recognition; never recycled to P&L on sale.
- FVOCI — Recycling. Sukuk and bonds in a hold-to-collect-and-sell model. Reserve in equity; recycled to P&L on disposal.
- Amortised Cost. Murabaha, term deposits, held-to-maturity sukuk. Carried at cost; SPPI test passed; interest to P&L.
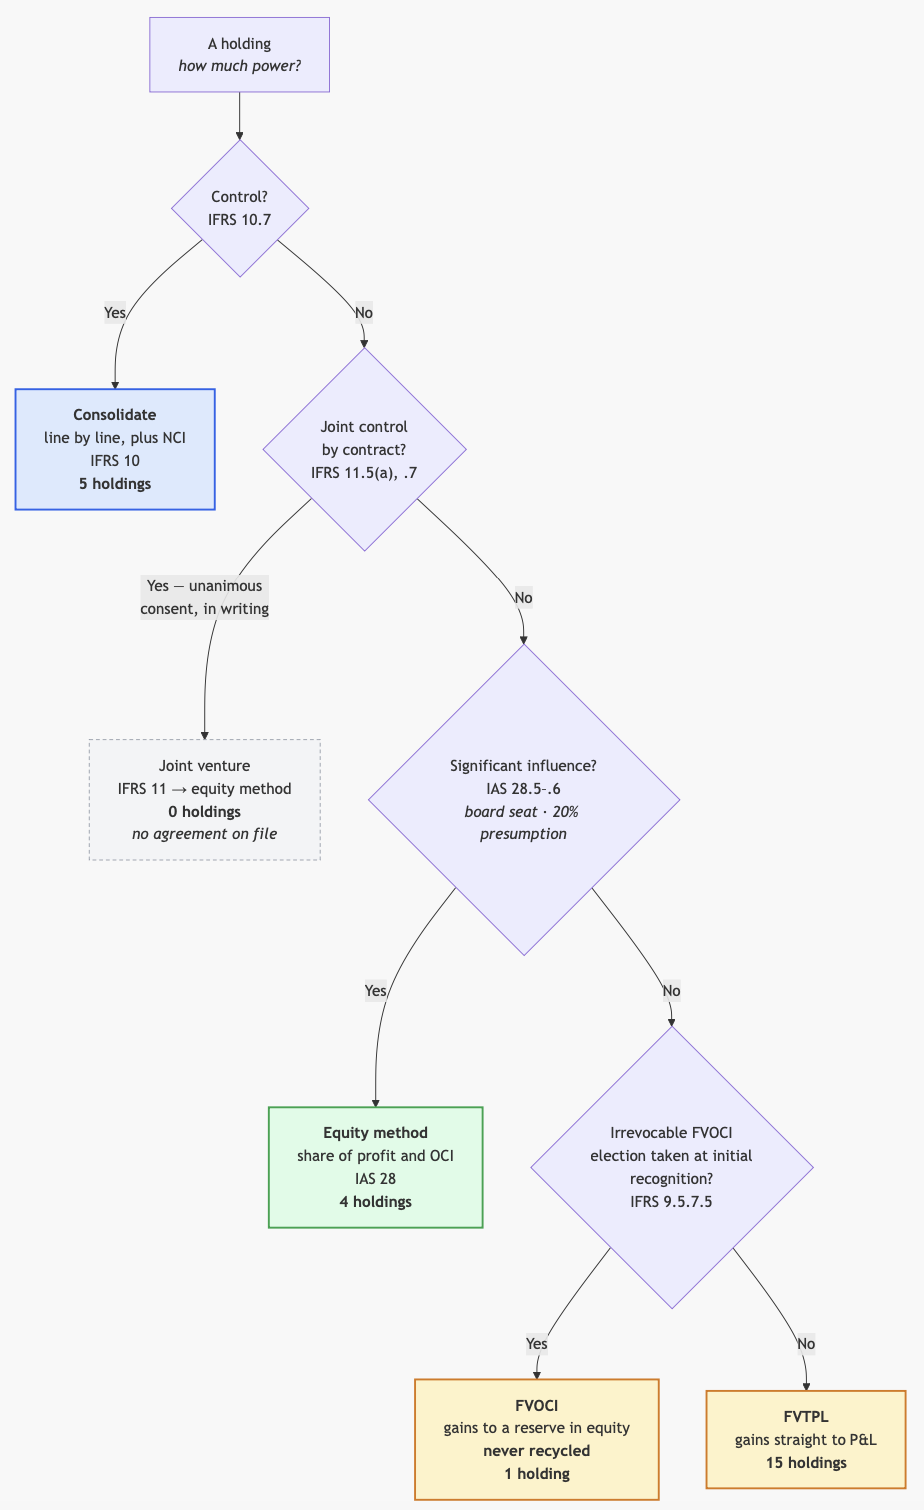
Cross the line into control, and the holding you carry at a healthy fair value in your management pack gets consolidated line by line in your statutory accounts under IFRS 10 instead. That last one is where things get uncomfortable. The fair value on your board pack isn't wrong — it's the right answer to what is my portfolio worth. But it's the wrong answer for the consolidated accounts, and a system with no ledger can only ever tell you one of those two numbers. This one tells you both, and shows you the bridge between them — which is exactly why “your fair values don't match our audited accounts” stops being an accusation and becomes a footnote.
The Month-End That Closes Itself
Ask any investment finance team where the hours go, and it's the same answer: booking the consequences. A dividend comes in — is it income, or a return of capital reducing the carrying value? A holding slips below cost — does that trigger an impairment, and who remembers to check? A valuation moves — where does the gain land, P&L or OCI? Every one of those is a judgment, and every judgment becomes a manual journal entry someone has to make, defend, and reconcile.
Now imagine the classification you set once already knows the answer. The dividend from a fair-value holding books as income; the identical dividend from an equity-accounted holding books as a return of capital, untouched by the P&L — automatically, because the system knows which holding is which. The impairment indicator fires on its own from a rule you defined at the start. Capital calls, management fees, performance fees, derivative mark-to-market, realized gains on exit — each carries its own defined accounting treatment and its own audit trail.
The number that tells the story: manual journal entries required — zero. Not fewer. None. Month-end stops being the thing you brace for and becomes something the ledger has already done while you were clicking through the portfolio.
The Alert Nobody Sent You
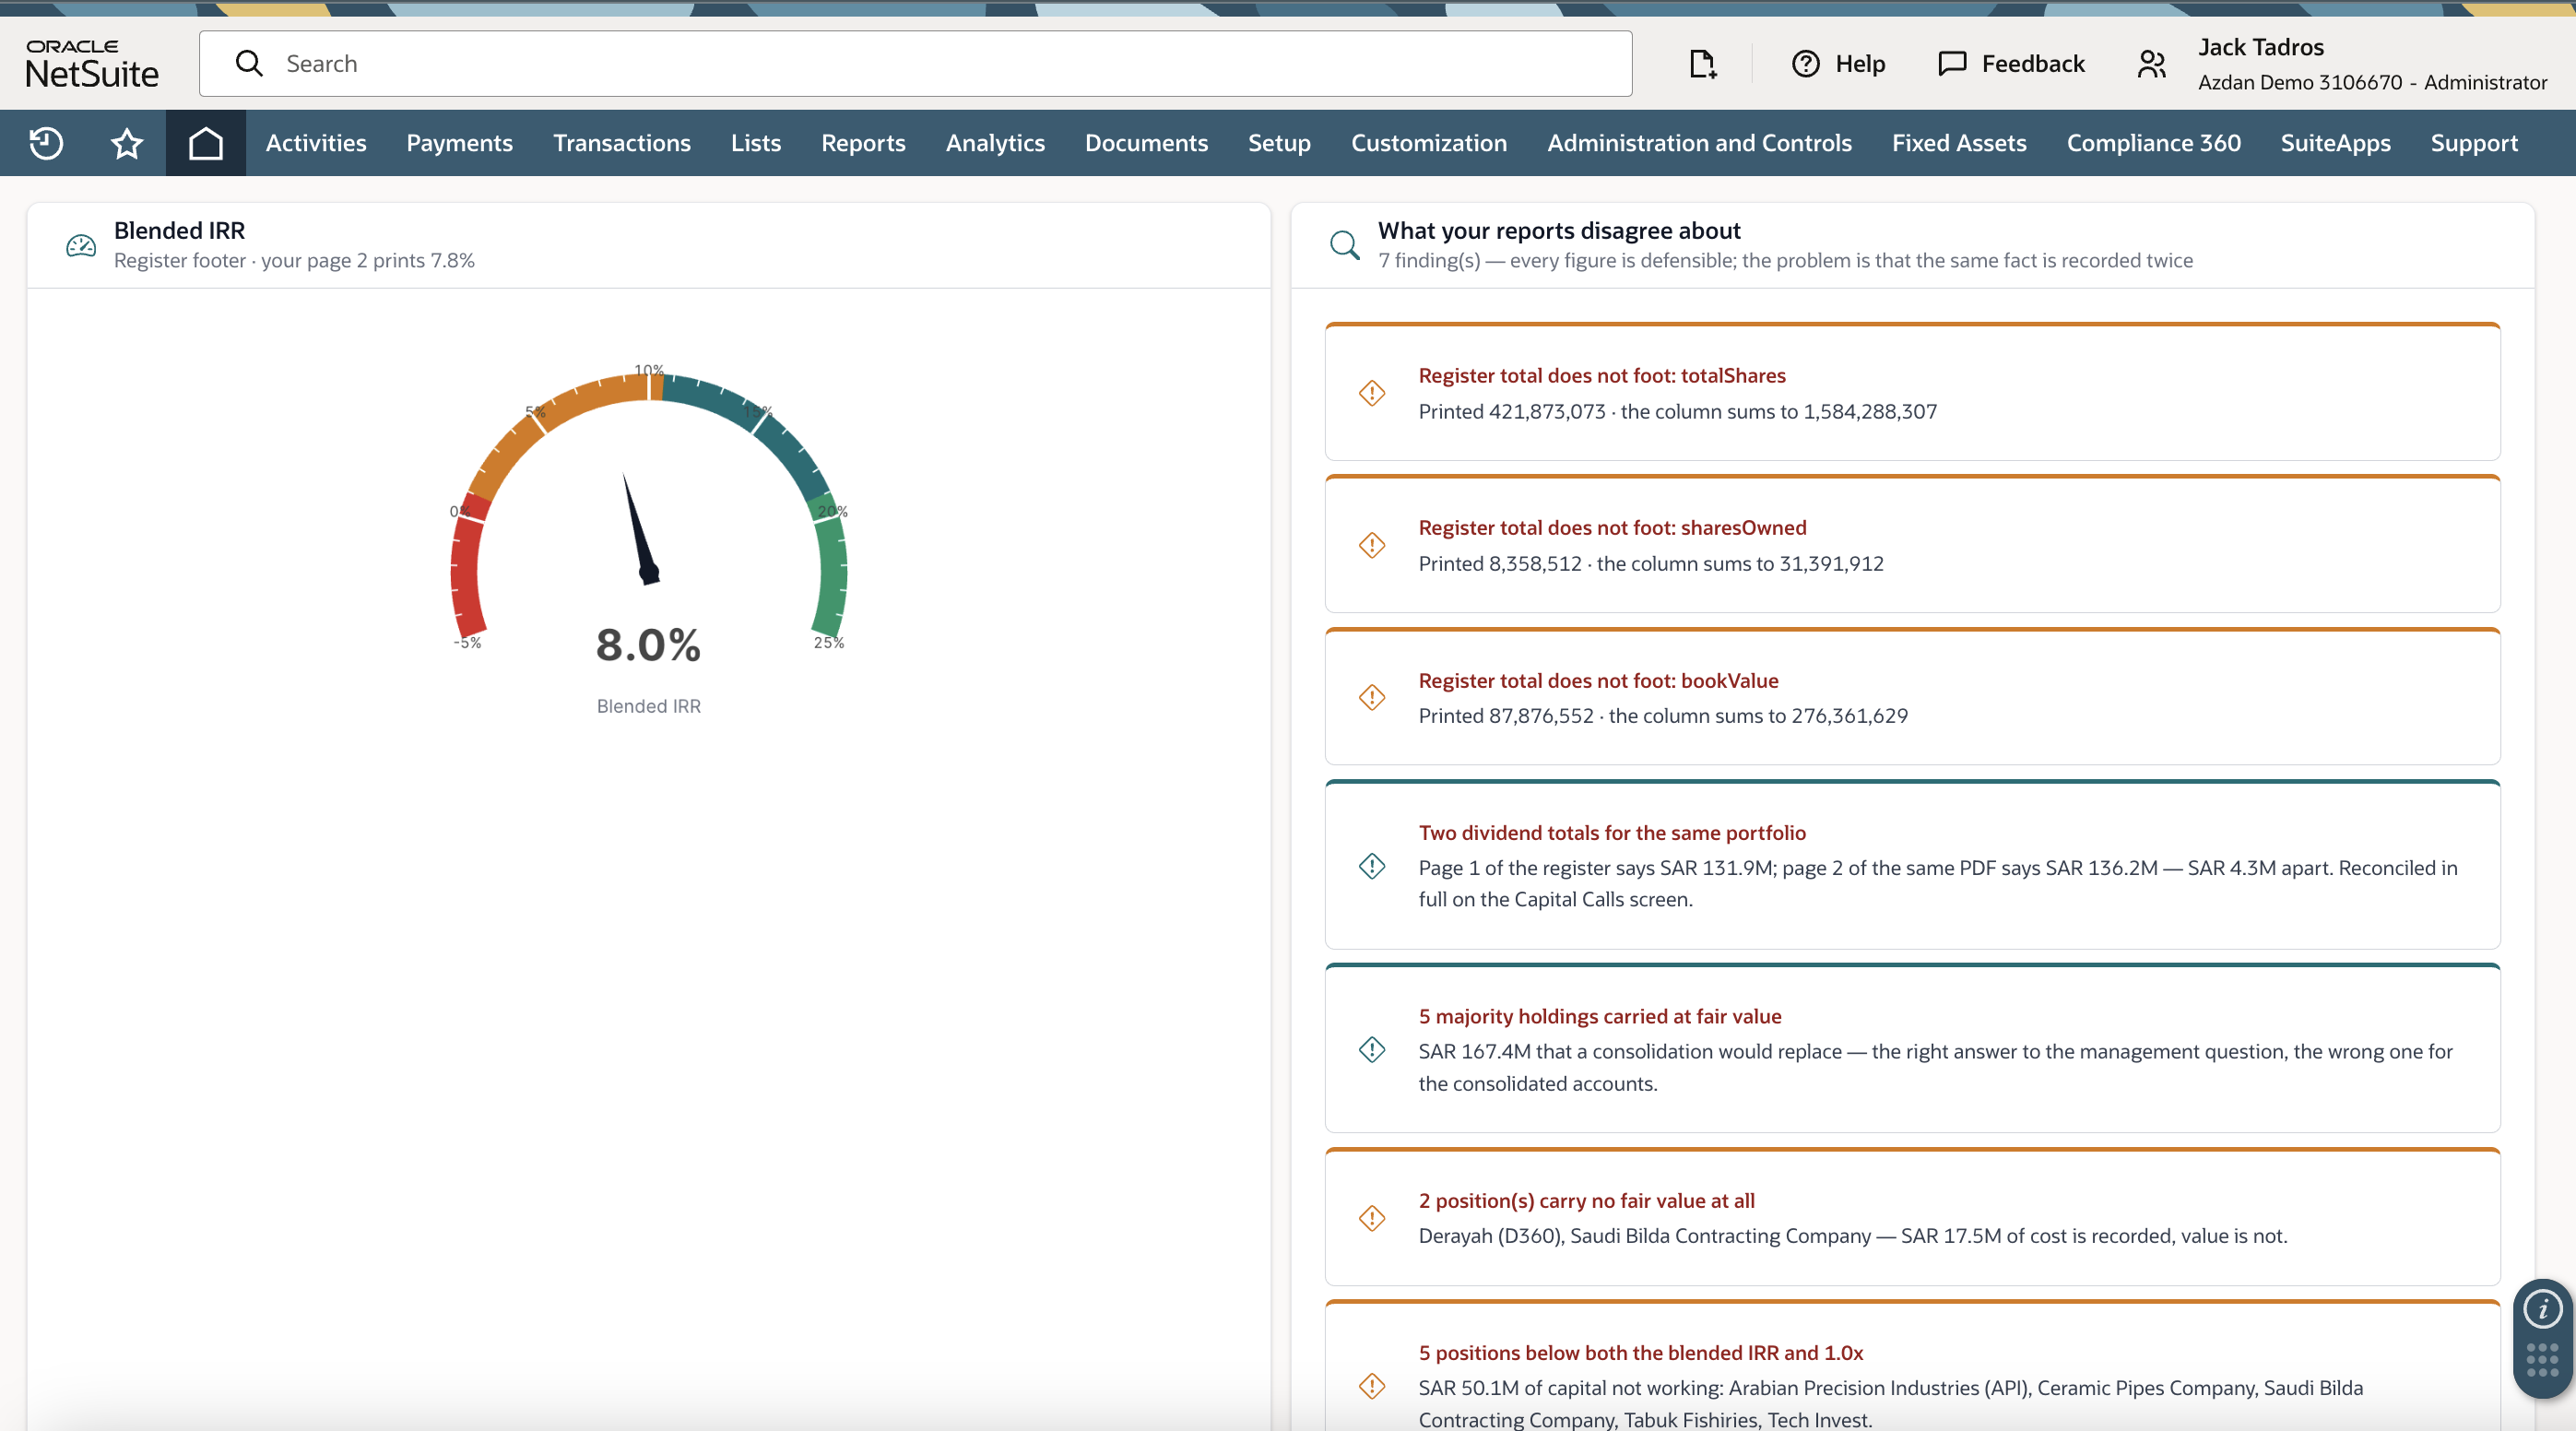
The most expensive risks in a portfolio are rarely the ones that show up in red. They're the ones hiding in plain sight across four separate reports that never met.
Take a single holding. Its company overview looks healthy. Its financial statement is fine. Its ratios are respectable. Its performance report is on plan. Four documents, four clean bills of health — and buried across them, a story no one told you: receivables ballooning, receivable turnover collapsing, operating cash flow sliding in the same year the company posted record EBITDA. Every one of those numbers was in a report you already had. Nothing joined them up, so nothing raised its hand.
Put those four reports on one record and the pattern becomes impossible to miss. That's the quiet superpower of a single ledger — not that it shows you more data, but that it shows you the data next to itself, where the insight actually lives.
Numbers You Can Stand Behind, Because You Know Where They Came From
There's a difference between a fair value and a fair value you can defend in a committee. The first is a figure in a cell. The second has a method behind it, a hierarchy level, an approver, and a date.
A proper valuation run gives every holding its method — market multiple, DCF, latest transaction, NAV, quoted price — and derives the IFRS 13 fair-value hierarchy level from that method rather than leaving someone to tag it by hand. Then it moves the batch through a workflow that behaves like a real control: draft, submitted, committee-approved, posted. Everything before that final step is editable. Everything after it is permanent — a correction becomes a reversal with its own author and its own date, never a silent overwrite.
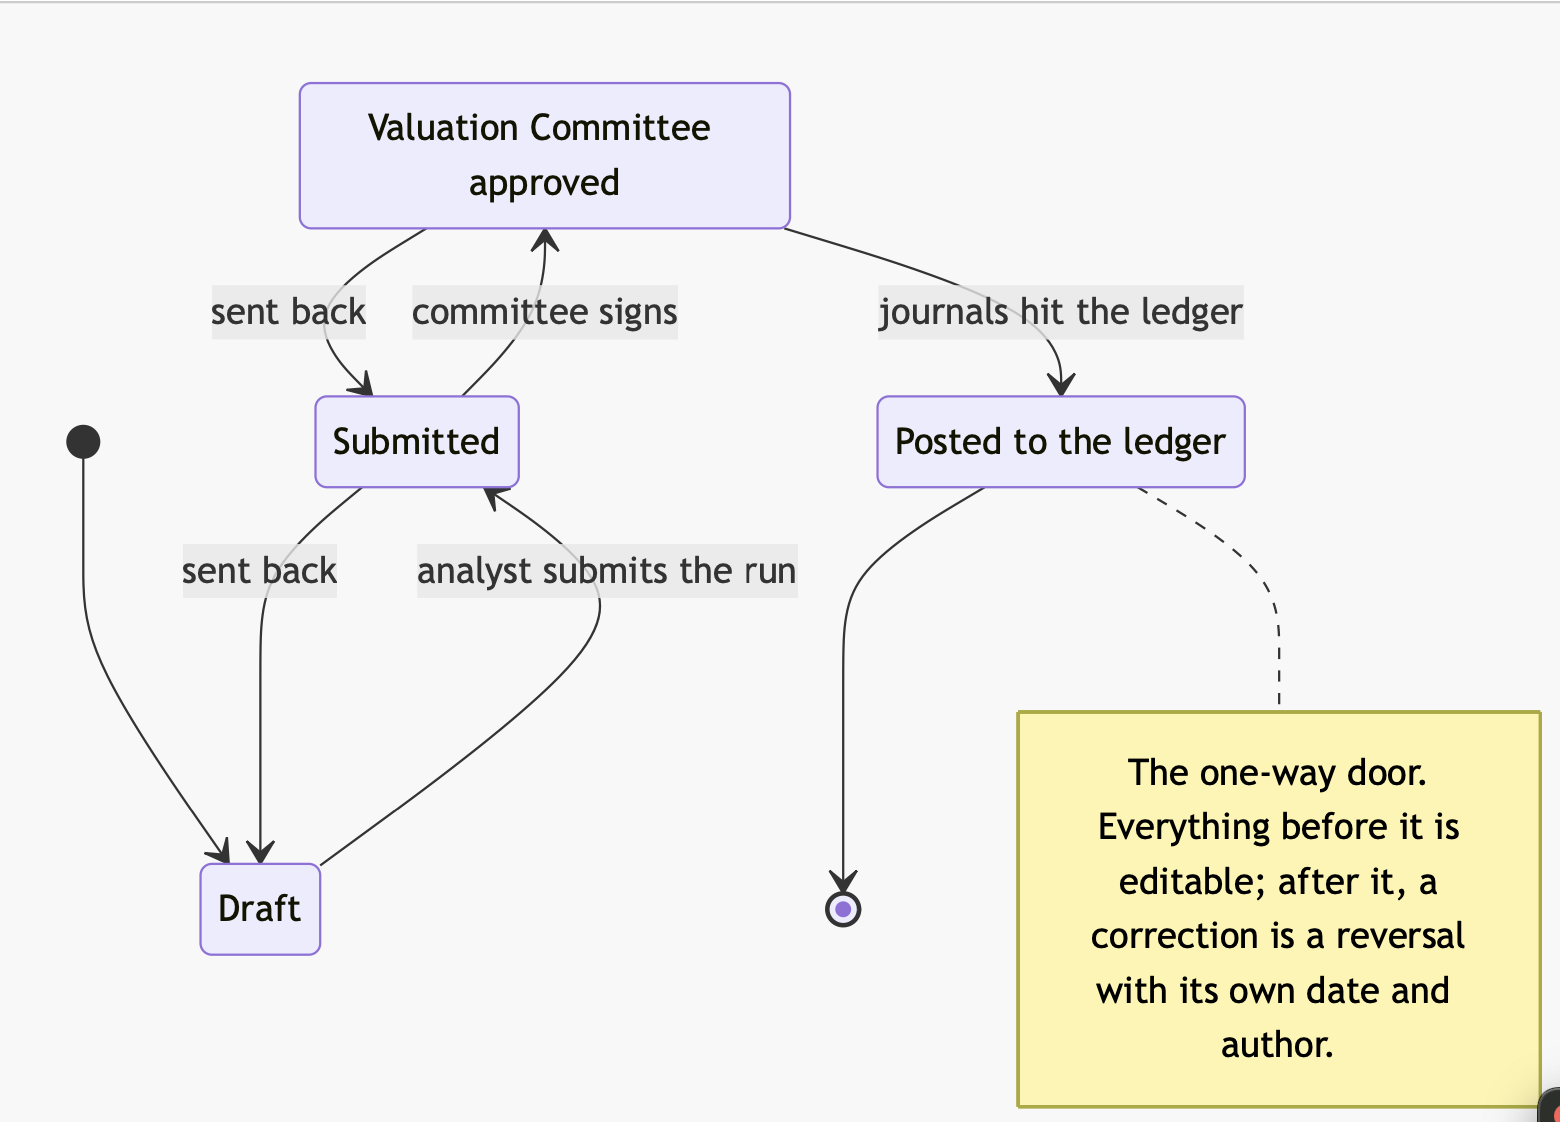
That's the difference between a spreadsheet anyone can quietly change the night before the meeting and a ledger that can tell an auditor, without hesitation, exactly who approved what and when. When someone asks “where did this valuation come from?”, you don't go looking. You point.
Every KPI, and the Honesty of Where It Comes From
Investment managers live and die by their metrics — but not every metric is born the same way, and pretending otherwise is how credibility leaks. Some KPIs are calculated natively from the ledger, provable from the underlying cash flows. Others — the sophisticated risk statistics that need daily pricing — come from your portfolio managers and are stored against the holding. A system worth trusting doesn't blur that line; it labels it. Here's the full set, and where each one actually comes from:
Headline figures
- Cost Deployed — Total capital invested across the book. Derived in NetSuite from the register.
- Fair Value — Current mark-to-market value of holdings. Derived from the latest valuation run.
- Unrealized Uplift — Fair value less cost, not yet in the ledger. Derived (fair value − cost).
- Dividends / Distributions Realized — Cash returned to date. Derived from recorded receipts.
- Total AUM — Assets under management, by asset class. Derived, broken down by class.
Performance metrics
- IRR (Internal Rate of Return) — Annualized return, weighted by cash-flow timing. Calculated in NetSuite via saved-search formula.
- Blended IRR — Portfolio-wide IRR across all holdings. Derived in NetSuite.
- MOIC (Multiple on Invested Capital) — (Current value + distributions) ÷ cost. Calculated in NetSuite.
- TWR (Time-Weighted Return) — Return stripped of the timing of your cash flows. Calculated in NetSuite.
- Returns MTD / QTD / YTD / ITD — Period-to-date return across every timeframe. Derived on the dashboard.
- J-Curve Tracking — Whether deployment is outrunning realization. Derived from the quarterly cost/proceeds series.
- Performance vs. Business Plan — Actual return against the number you promised the board. Compared against stored plan figures.
- Cash Yield — Income return on real assets. Imported / stored.
Private equity multiples
- TVPI (Total Value to Paid-In) — Total value, realized and unrealized, per rial in. Calculated in NetSuite.
- DPI (Distributions to Paid-In) — Cash actually back in hand, per rial in. Calculated in NetSuite.
- RVPI (Residual Value to Paid-In) — Value still on the table, per rial in. Calculated in NetSuite.
Risk metrics
- Sharpe Ratio — Return earned per unit of risk taken. Imported from portfolio managers.
- Sortino Ratio — Return per unit of downside risk. Imported from portfolio managers.
- Max Drawdown — The worst peak-to-trough fall you'd have lived through. Imported from portfolio managers.
- Volatility (Std. Dev.) — How much returns swing around the average. Imported from portfolio managers.
- Beta — How hard the holding moves when the market does. Imported from portfolio managers.
- Correlation to Benchmark — Whether it moves with the index or against it. Imported / stored.
- Duration — Interest-rate sensitivity of fixed income. Imported / stored.
- Inflation Sensitivity — How real assets respond to inflation. Imported / stored.
- VaR (Value at Risk) — Potential loss at a given confidence level. Import only — not calculated in NetSuite.
Monitoring & alerts
- Asset Allocation vs. Target — Where you actually sit against your mandate. Saved search, actual vs. target.
- Allocation Breach Alert — An asset class has drifted >5% off target. Workflow trigger.
- Concentration Limit Alert — One position has grown too large to ignore. Workflow trigger.
- Maturity Alert — Fixed income maturing within 30 days. Workflow trigger.
- Capital Call Due Alert — A PE capital call is due within 14 days. Workflow trigger.
Notice the last column doing the quiet work. NetSuite is an ERP and a ledger, not a risk-analytics engine — and it doesn't pretend to be. The multiples and headline figures are calculated, provable, yours. The heavy risk statistics are imported from the managers who price daily, then stored where you can see them beside everything else. Monte Carlo and stress testing live elsewhere, on purpose. Knowing which of your numbers is calculated and which is imported isn't a limitation — it's the provenance every disconnected spreadsheet stack quietly destroys.
The Board Pack That Builds Itself
By the time you reach the review, the hard part should be behind you. A dashboard shows total AUM by asset class, returns across every timeframe, actual allocation against target, your best and worst performers, and the capital calls and maturities coming at you — all drillable down to the single investment. The standard reports — daily summary, monthly performance, quarterly investor pack — schedule and send themselves.
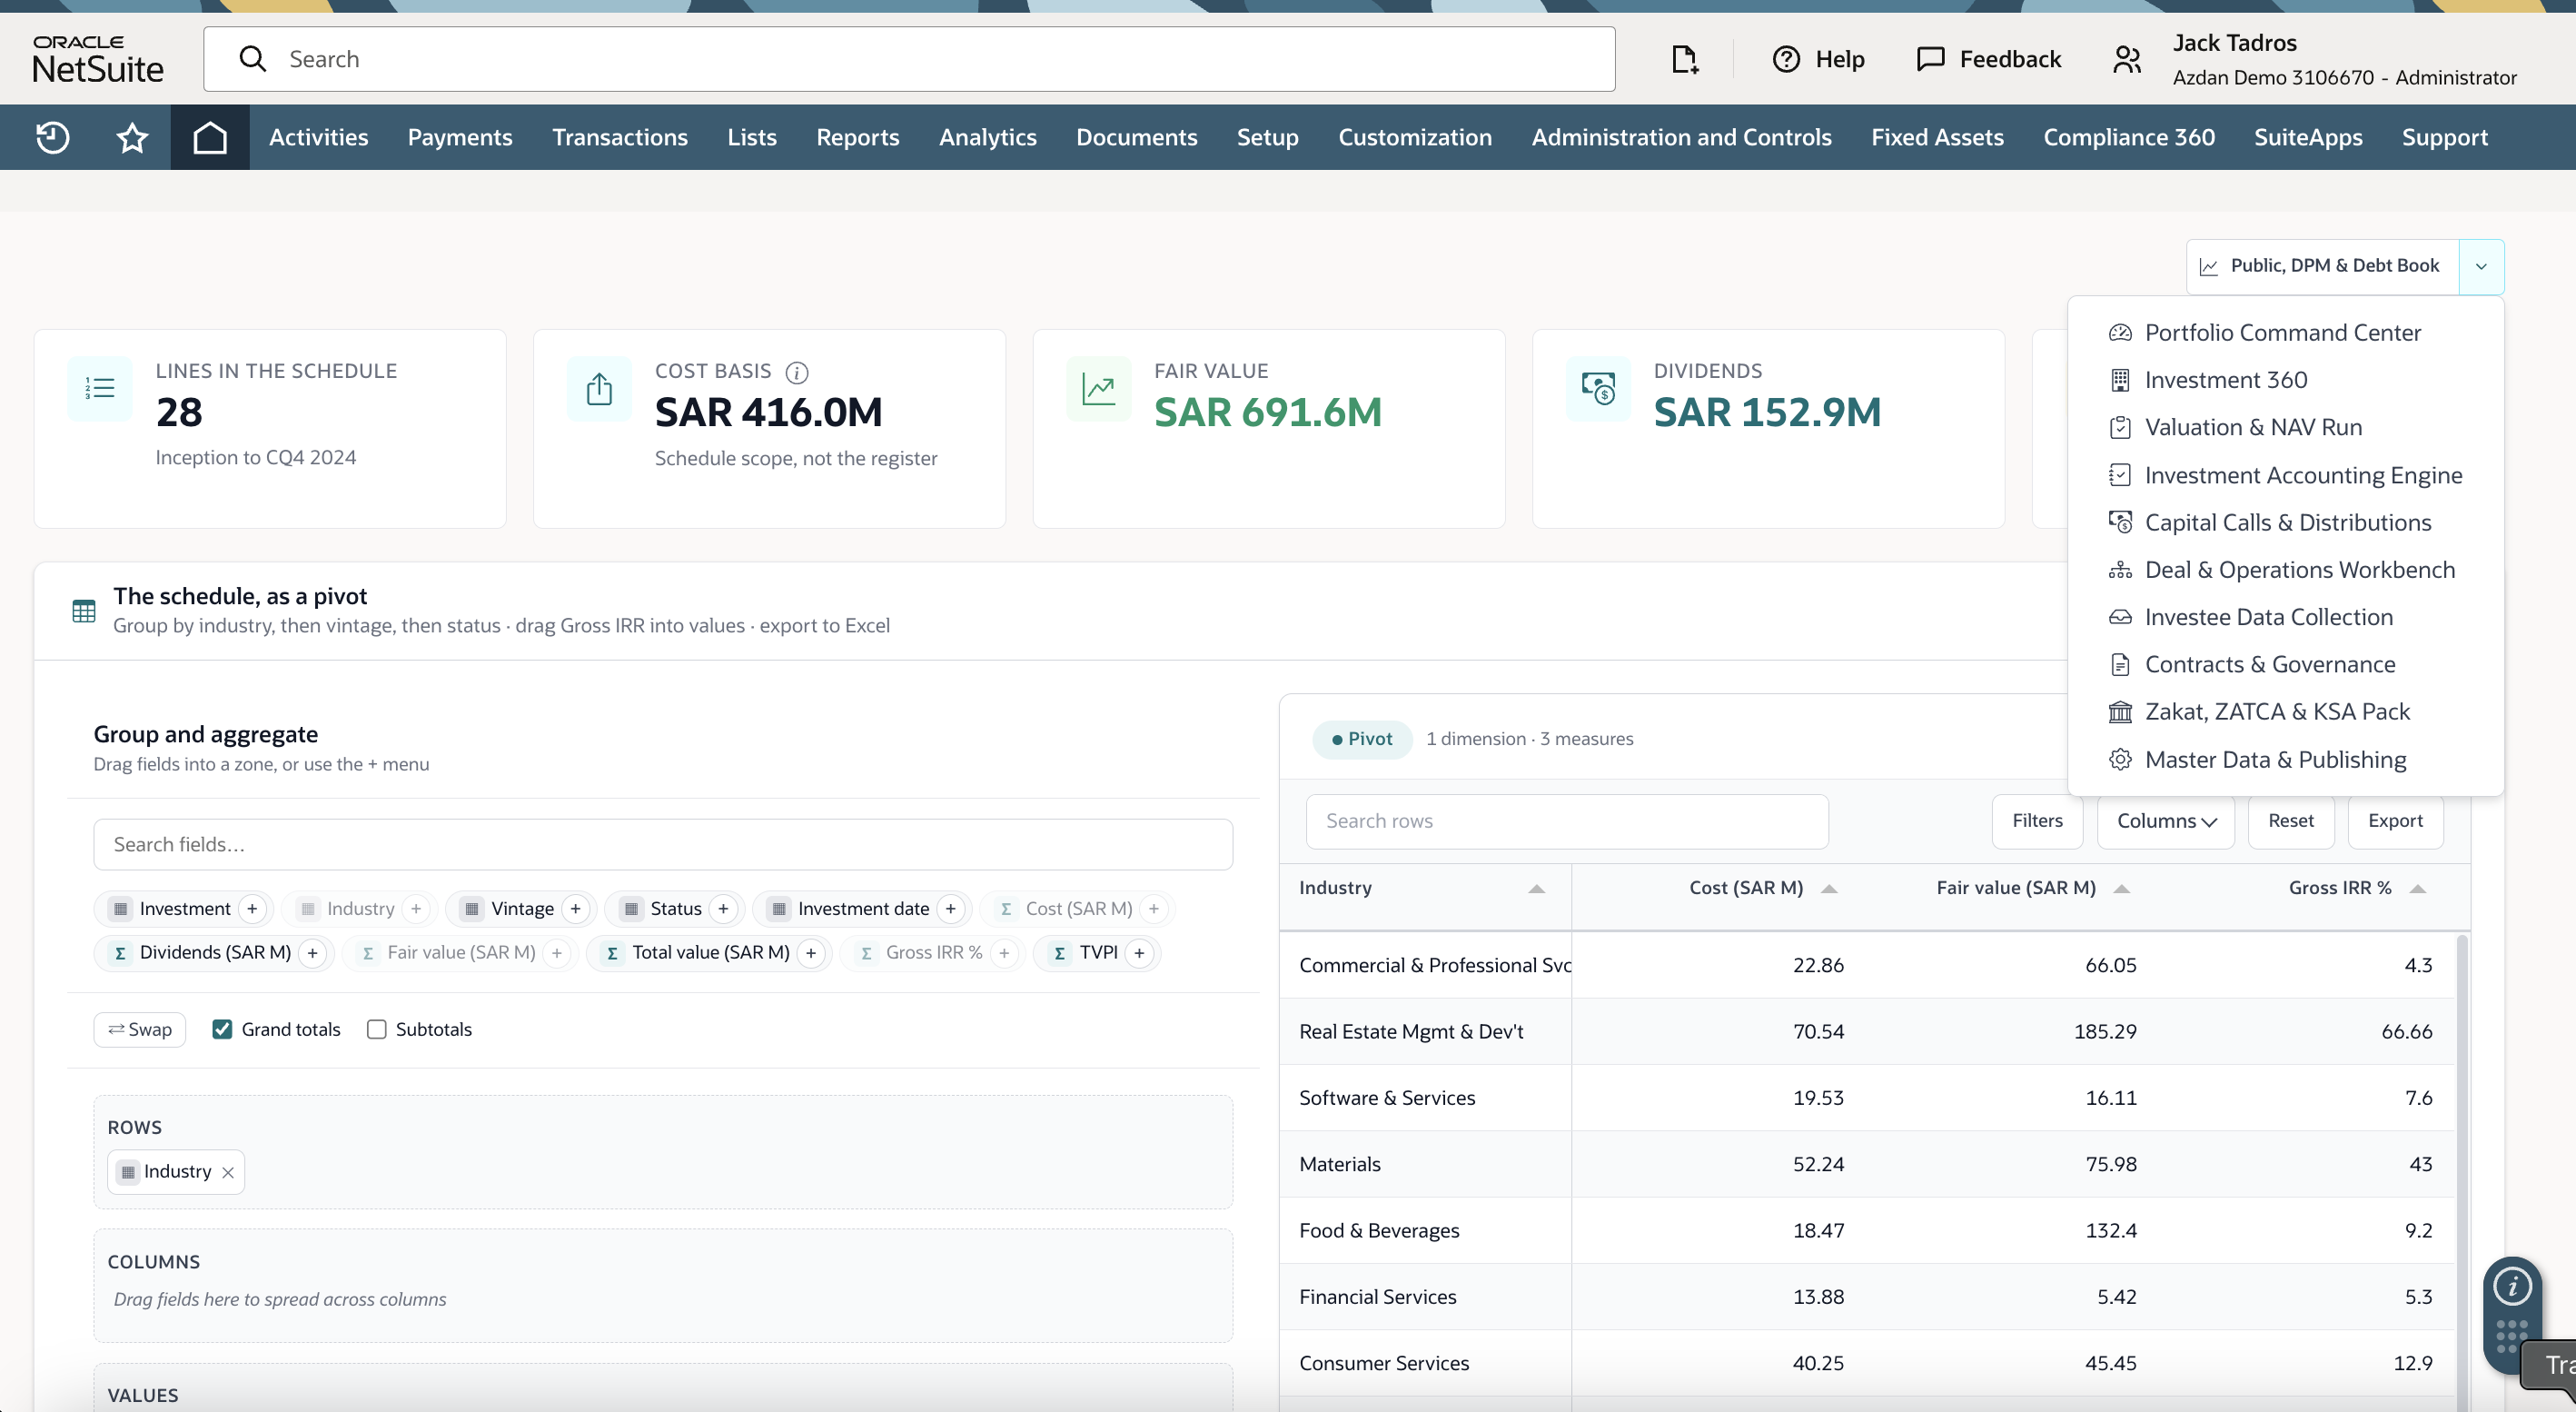
And when the question comes that no pre-built report anticipated — group by industry, then vintage, then status, and show me gross IRR — you don't file a request and wait. You pivot the live schedule right there, against the same ledger every other number came from, and export it before the meeting moves on.
One Picture, Moving as One
This is what a portfolio review feels like when the reconciliation is already done. The J-curve, the NAV bridge from cost through unrealized uplift to fair value to total value, the risk-and-return map, the allocation sunburst you can zoom straight into a single company — all on one screen, all drawing from one ledger. Change the as-of date and everything moves together, because there's nothing to hold out of sync. No five exports to line up. No four numbers to reconcile at midnight.
What Breaks: Six Recurring Failures
These are patterns that recur when a portfolio is run across disconnected systems. They are drawn from delivery experience and offered as recommendations rather than measured findings.
- The same fact lives in more than one place. Four reports, four portfolio returns, no mechanical way to reconcile them. This is the root cause, not a symptom.
- Classification treated as an afterthought. IFRS 9 treatment decided at reporting time rather than at recognition, so the accounting never quite matches the position.
- Manual journals at every month-end. Dividends, revaluations, and impairments booked by hand, each one a judgment someone has to defend.
- Fair values with no provenance. A number in a cell that no one can trace to a method, an approver, or a date.
- Risk metrics presented as if calculated. Imported statistics shown without flagging that they came from a manager's feed, not the ledger.
- The board pack rebuilt from scratch each quarter. Hours spent reassembling a portfolio view that should already exist, live, in one place.
Reading Your Own Portfolio: Four Questions
- How many different portfolio returns can your systems produce, and can you reconcile them on demand? If the answer is more than one and the reconciliation takes a night, the fact lives in too many places.
- When is each holding classified under IFRS 9 — at recognition, or at reporting? The later it happens, the more the accounting drifts from the position.
- How many manual journals does an investment month-end take? Every one is a judgment the classification should have made for you.
- For any fair value on your last board pack, can you name the method, the approver, and the date? If not, it is a figure, not a valuation.
Recommendation
If you are assessing investment portfolio management on NetSuite, produce one number before anything else: how many distinct portfolio returns your current stack can generate for the same book, same date. Most teams discover the answer is three or four, each defensible, none reconciled without effort.
Expressed that way, the problem stops being a data-entry irritation and becomes what it actually is — an architecture question. Classification driving accounting, accounting driving valuation, valuation driving reporting, all from a single ledger, is the answer that makes the number one.
One ledger. One number.
Sources
- IFRS 9, Financial Instruments, for the classification and measurement of financial assets (FVTPL, FVOCI, amortised cost)
- IFRS 10, Consolidated Financial Statements, for control and line-by-line consolidation
- IAS 28, Investments in Associates and Joint Ventures, for the equity method
- IFRS 13, Fair Value Measurement, for the fair-value hierarchy and disclosure
- Oracle NetSuite, Financial Services ERP, for the ledger and reporting foundation
Process content reflects investment management leading practice as applied by Azdan, checked August 2026.
Related Azdan Resources
Published by Azdan, an Oracle NetSuite Solution Provider operating across the UAE, Saudi Arabia, and Egypt. Guidance in this article reflects Azdan's implementation work with investment companies, family offices, and holding groups. Content checked August 2026.