.svg)


In short: Follow one season through a NetSuite agriculture implementation - from the plan written before anything is planted, through the allocation cycles that turn shared cost into crop cost, to the drilldown that answers the question a farm manager always asks.
In most farm ERP discovery sessions, the same complaint surfaces within the first hour. A farm manager is being charged for spare parts he never ordered and never saw. He doesn't own the tractors and has no access to the workshop's purchase orders, but the cost is sitting in his crop P&L, and finance can't tell him how it got there.
He usually isn't wrong to push back, and finance usually isn't wrong to charge him. The parts went onto a well engine and a tractor, and both worked his fields. The cost genuinely belongs to his crop. What's missing is the trail that proves it.
Most articles about agricultural ERP list modules. This one follows a season through the system in roughly the order the questions come up, because that ordering is what determines whether the implementation works. Points where these projects tend to get difficult are flagged as they arrive, since those are usually more useful than the feature list.
Starting with the season plan, not the chart of accounts
It's tempting to begin an agricultural implementation in finance, since that's where the ERP conversation usually starts. It's better to start with the operational calendar, because costing without a plan gives you numbers with nothing to compare them against.
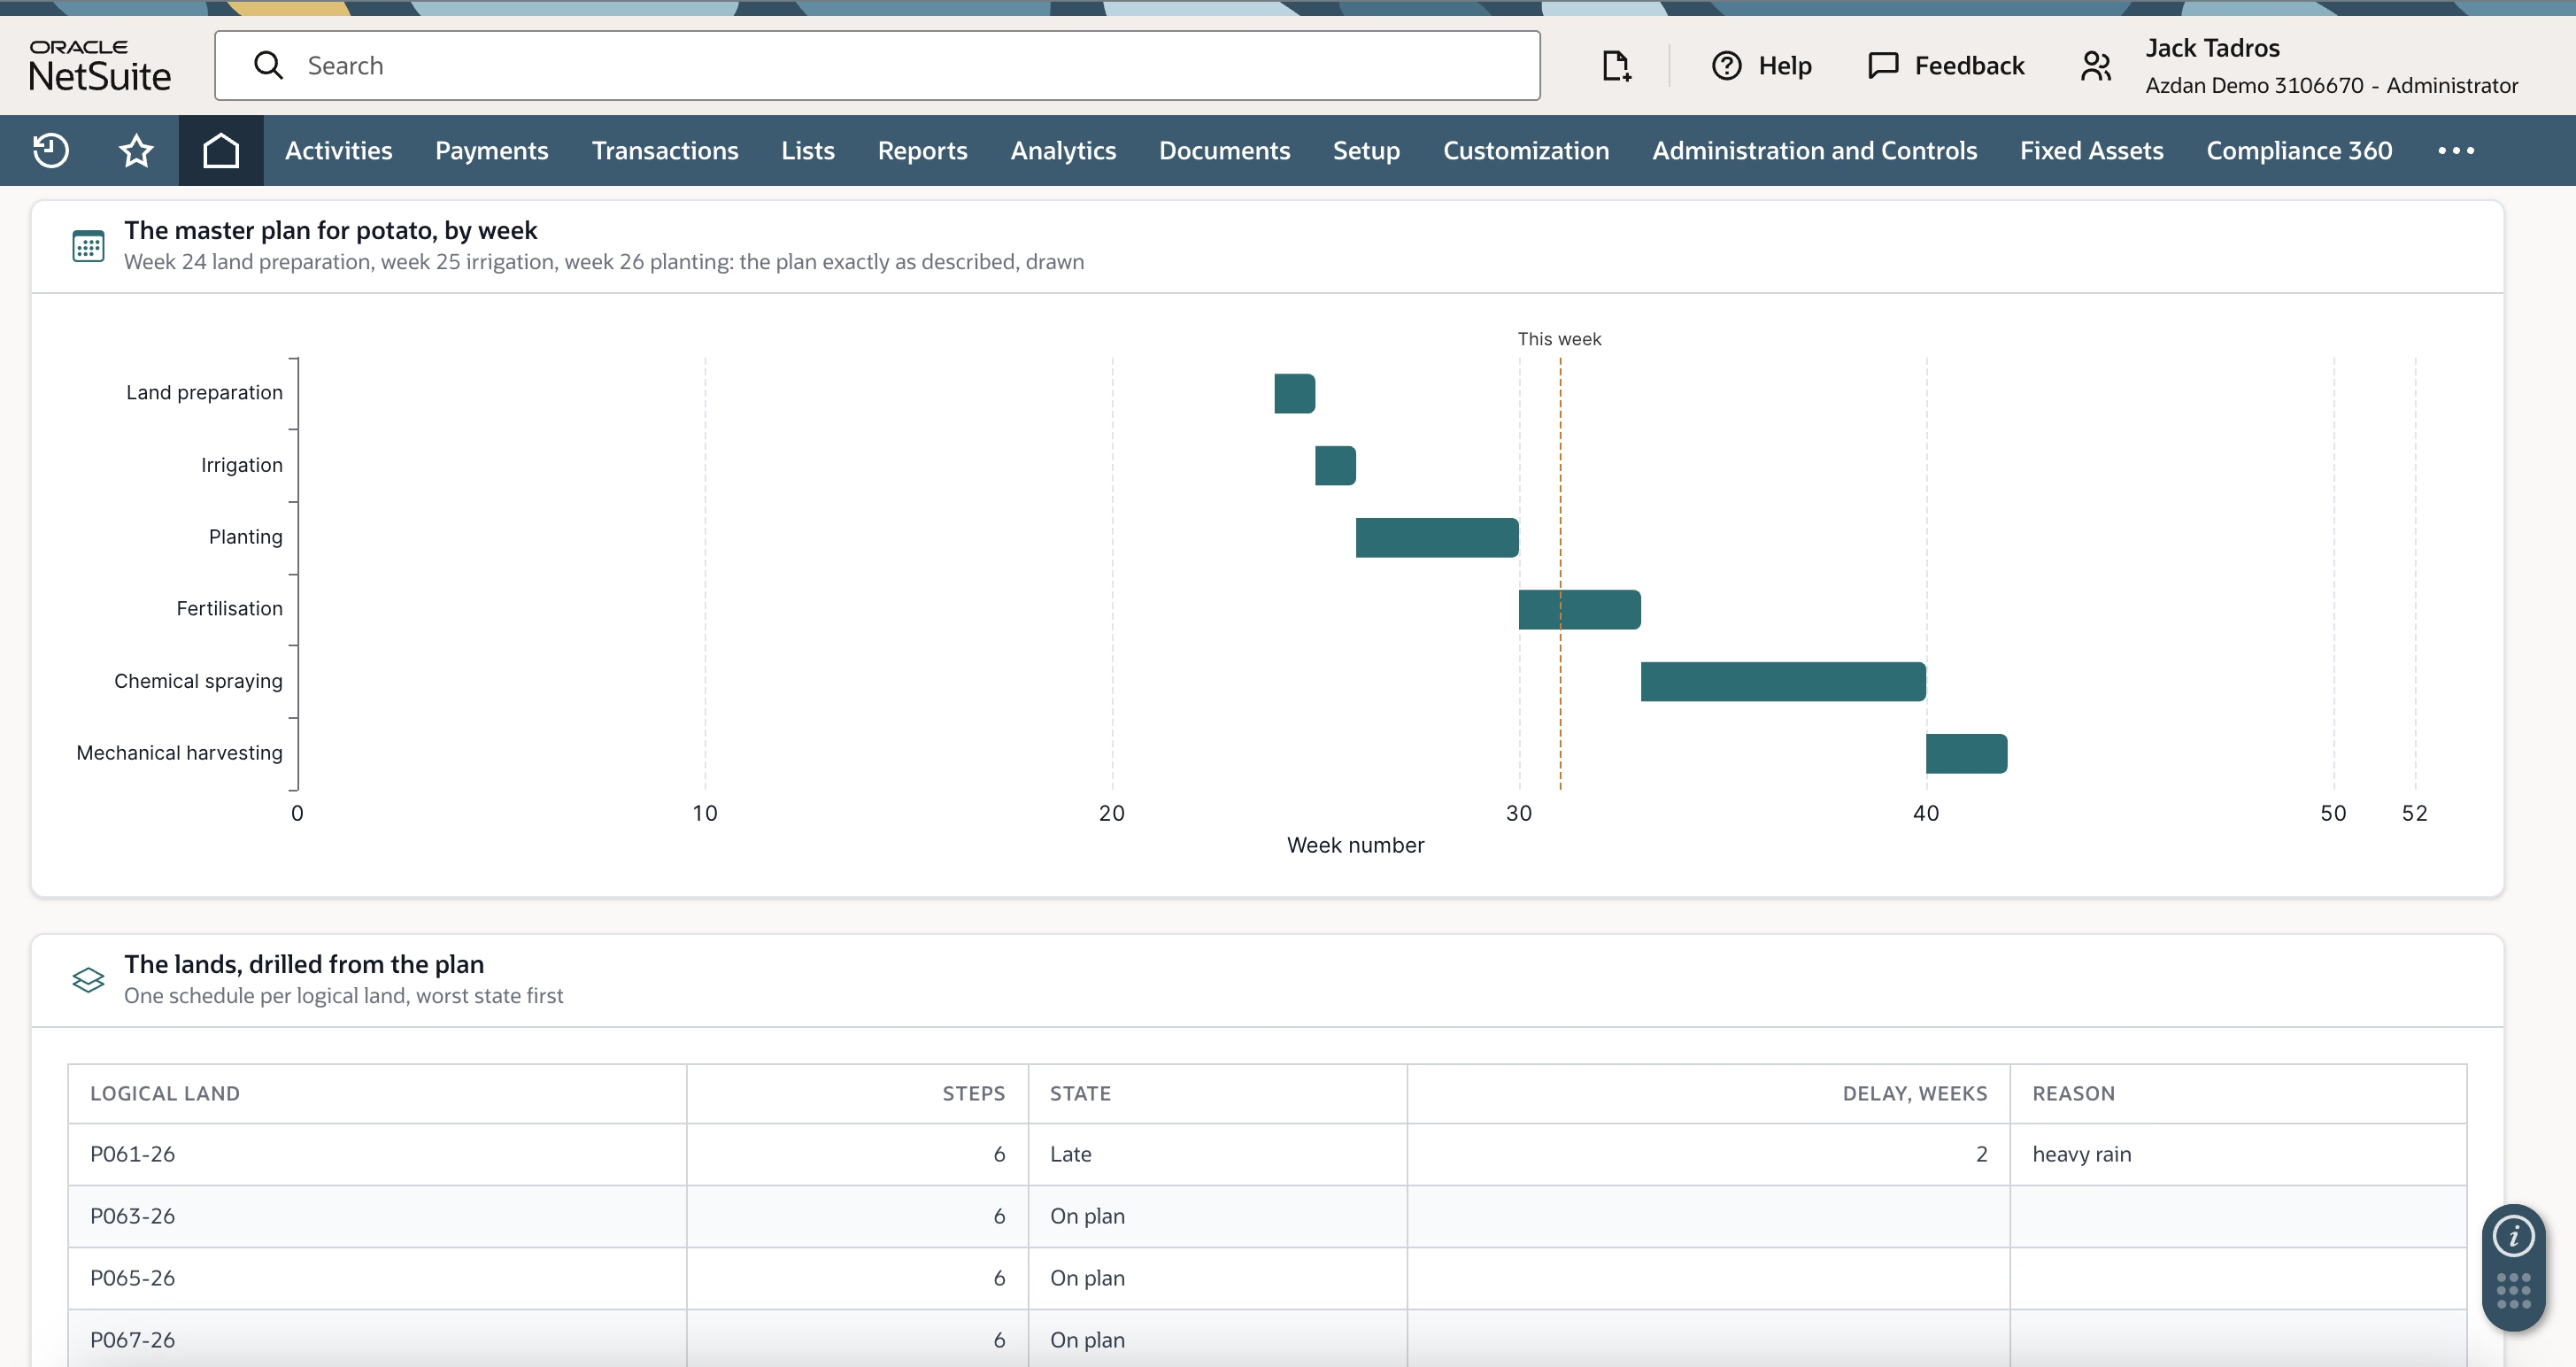
The master plan sets out each crop's activities across the season - land preparation, irrigation, planting, fertilisation, spraying, harvest - each with a target week. That plan then breaks down to every logical land parcel, so schedules are tracked at the level work actually happens rather than at crop level.
The value shows up when something slips. If heavy rain delays one parcel by two weeks, that parcel carries the delay and the reason while the others stay on plan. Nobody has to reconstruct at season end why one field ran behind, which matters both for the post-season review and for explaining a yield variance to a board.
Getting field costs into the ledger at the point of capture
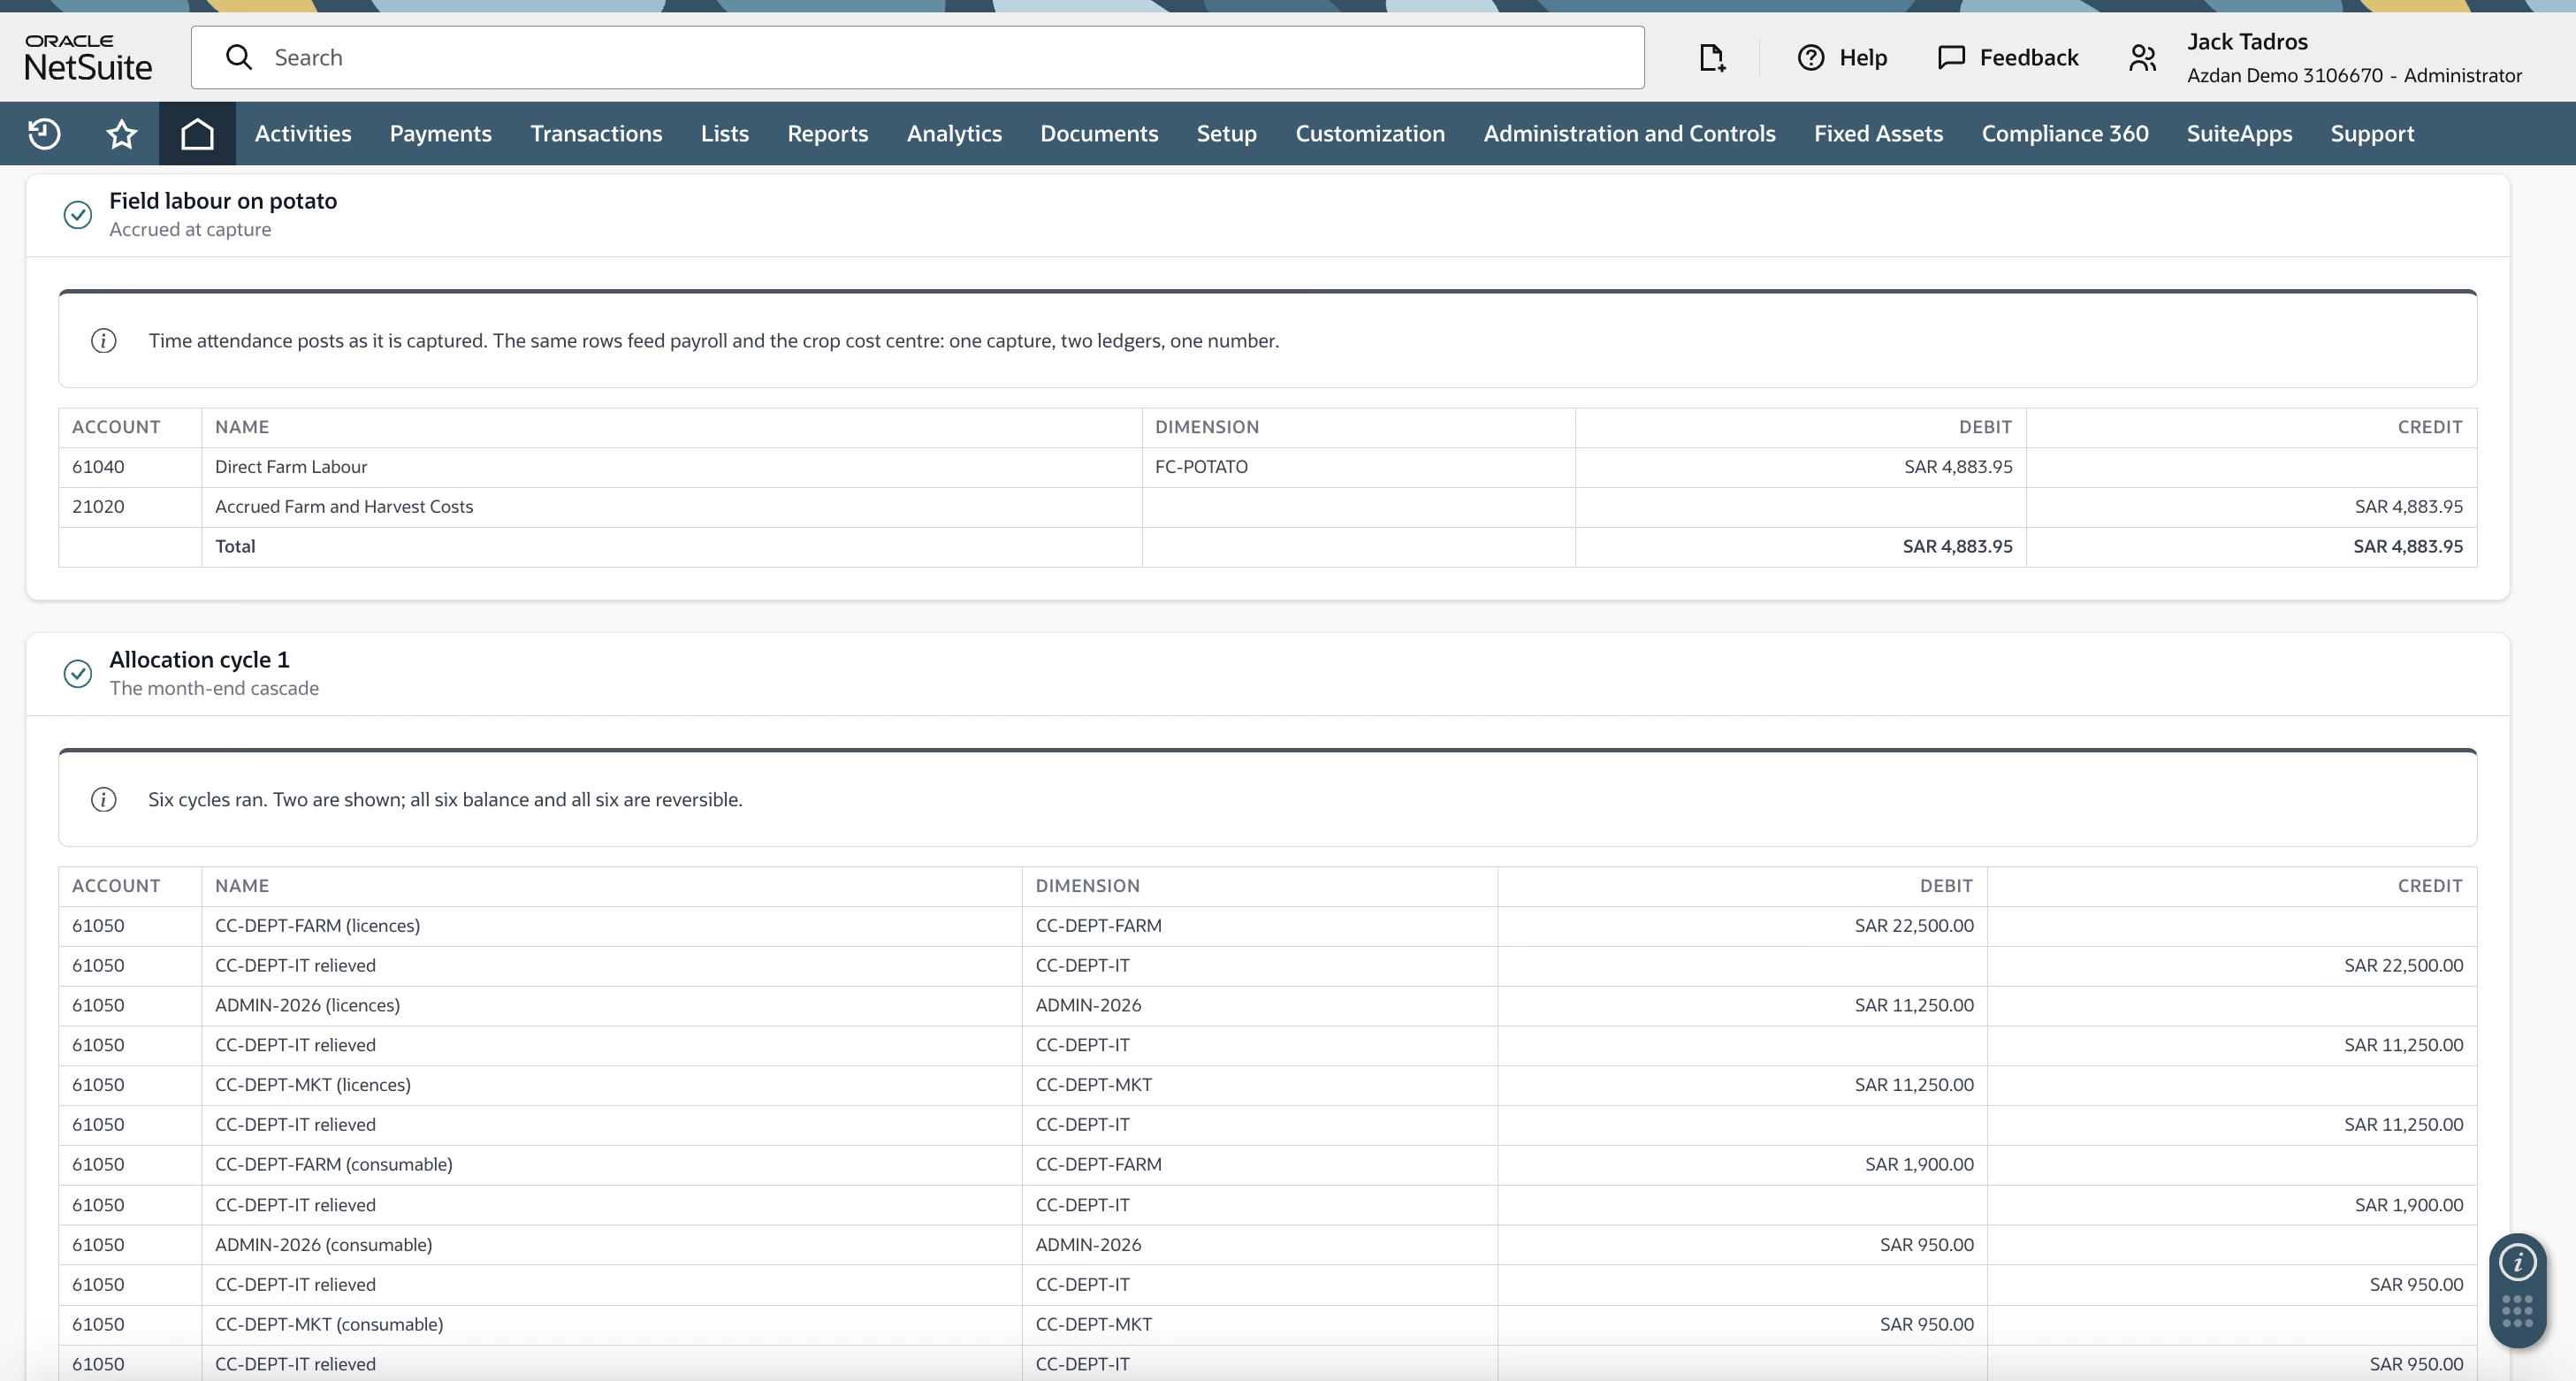
Farm labour is the cost most commonly reconciled after the fact, usually in a spreadsheet, usually a month late. Time attendance gets captured in the field, payroll processes it, and someone then works backwards to apportion it across crops.
It's worth configuring this so the capture posts directly. When a crew's hours are recorded against a crop, the entry debits direct farm labour to that crop's cost centre and credits an accrual until payroll runs. Payroll and crop costing then read from the same source records, which removes the reconciliation rather than speeding it up.
The obstacle here is rarely technical. It's getting reliable capture in the field, which depends on device choice, connectivity and supervisor discipline more than on anything in NetSuite. Budget time for it.
Costs that can't be assigned to a crop when they're incurred
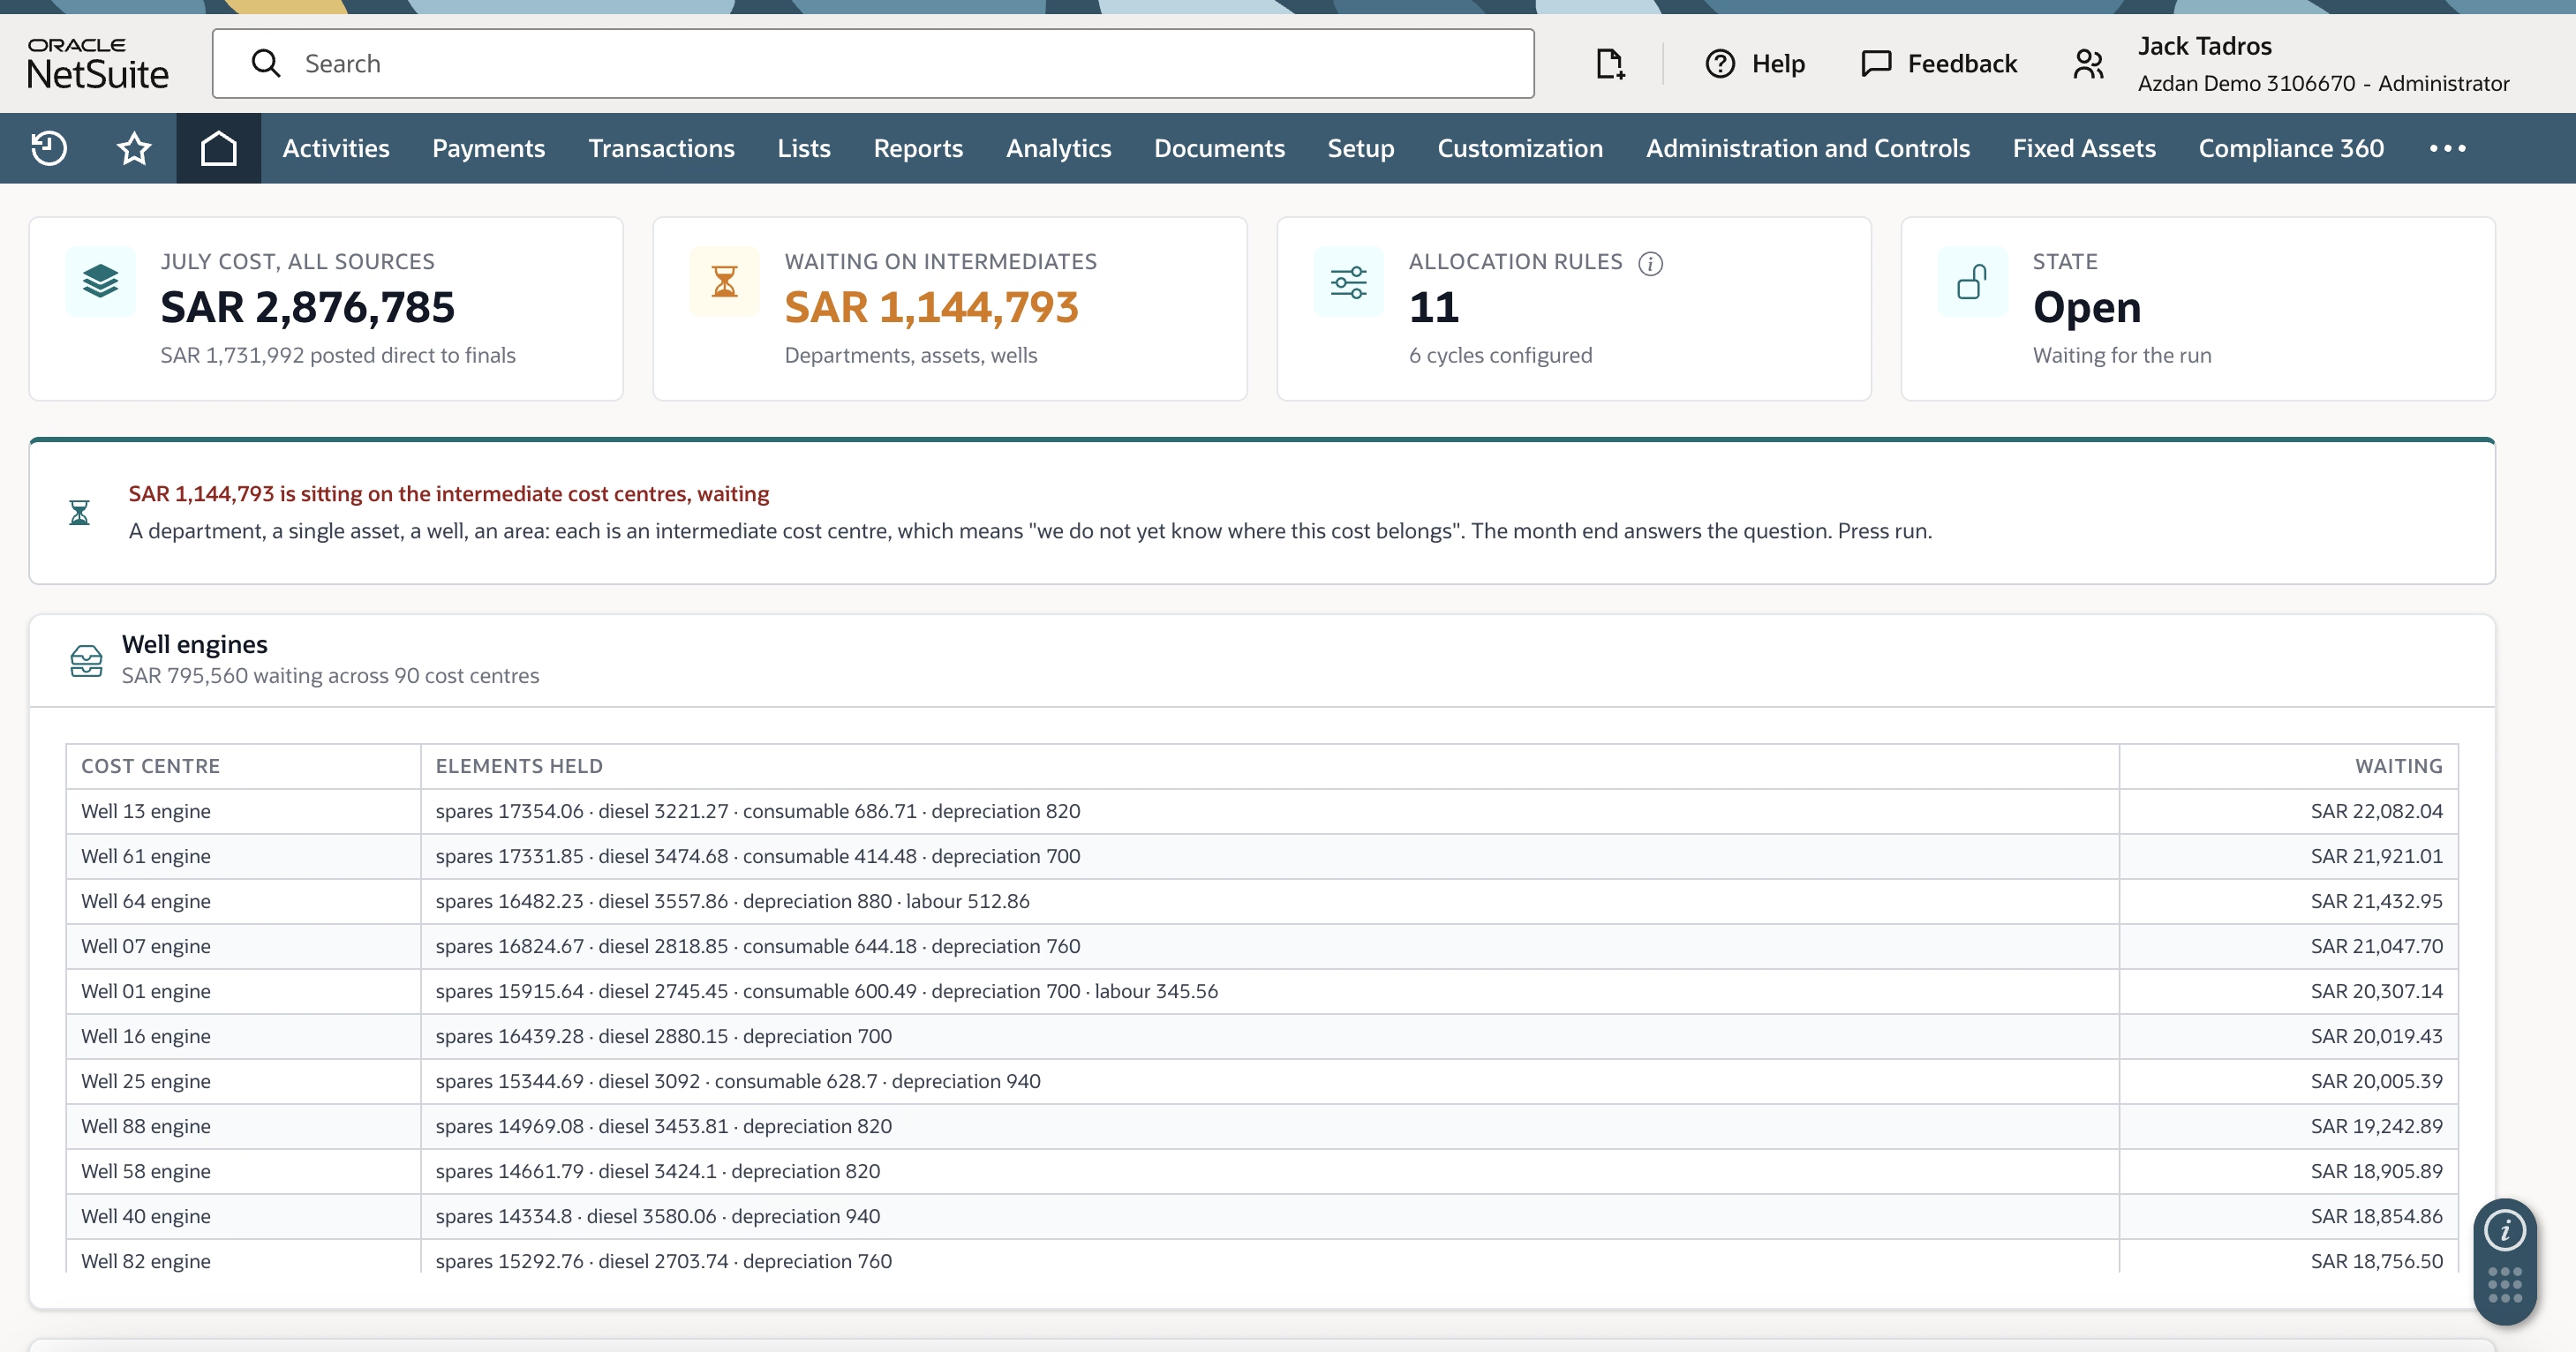
Plenty of farm cost can't be attributed to a crop at the moment it arrives. Diesel goes into a well engine that feeds several pivots. Spares go onto a tractor that worked four fields last week. Software licences belong to the IT department, which serves the farm, the office and the sales team.
The standard approach is to hold these on intermediate cost centres: departments, individual assets, wells, areas. An intermediate cost centre is a formal way of recording that the cost is real but its final owner isn't yet known. Through the month you can see exactly how much is sitting in that state, which is itself a useful control, since an unexpectedly large balance usually means a coding problem upstream.
Before configuring any of this, map the relationships visually and walk finance and operations through it together. Departments feed crops and admin. Vehicles feed departments. Well engines and tractors feed crops directly. Each connection is an allocation rule with its own basis, and the map is usually where clients first realise how many rules they'll actually need.
![Network diagram of departments, well engines, tractors and crops connected by allocation rules. Upload in the Webflow editor.]](https://cdn.prod.website-files.com/69bed4a3501e7a0235809ad0/6aba432696ae2ca82c666a58_Cost%20Object%20Network.avif)
Why one asset often needs more than one allocation basis
This is the detail that separates a cost model farm managers accept from one they argue with every month, and it's worth taking time over in discovery.
Consider a single well engine feeding three pivots, two planted and one lying fallow for the year. Diesel and consumables on that engine track consumption, so the sensible basis is the volume of water each pivot drew. Spares, depreciation and mechanic hours relate to the asset serving the area rather than to how hard it ran, so hectares is the better basis for those.
That means one asset, two bases, split by cost element. The fallow pivot's share of the hectare-based elements has no crop to go to, so it sits as work in progress until a crop is chosen. Charging it to a neighbouring pivot would misstate that crop's cost, and that is exactly the kind of thing that gets a cost model rejected by the people it's meant to serve.
Most clients arrive expecting a single basis per source. Element-level bases usually take a session or two to land, but they're worth the time.
Running the close
At month end the cycles run in sequence. Departments clear first, then vehicles and lines, then well engines, then tractors, then the remaining pools down to final cost objects. Ordering matters, because a department that receives cost from a vehicle has to clear after that vehicle does. Most farms end up somewhere between three and ten cycles depending on how many layers of shared service sit above the crops.
Every rule should be an effective-dated setting rather than scripted logic. Bases change between seasons, and finance needs to make that change without raising a development ticket.
The journals are ordinary double entry. Each pool is debited out to its targets and credited as relieved, with rounding posted explicitly rather than absorbed silently into the last line. Cycles should be reversible, because the first two or three closes after go-live almost always need a rerun once someone spots a basis that was set wrong.
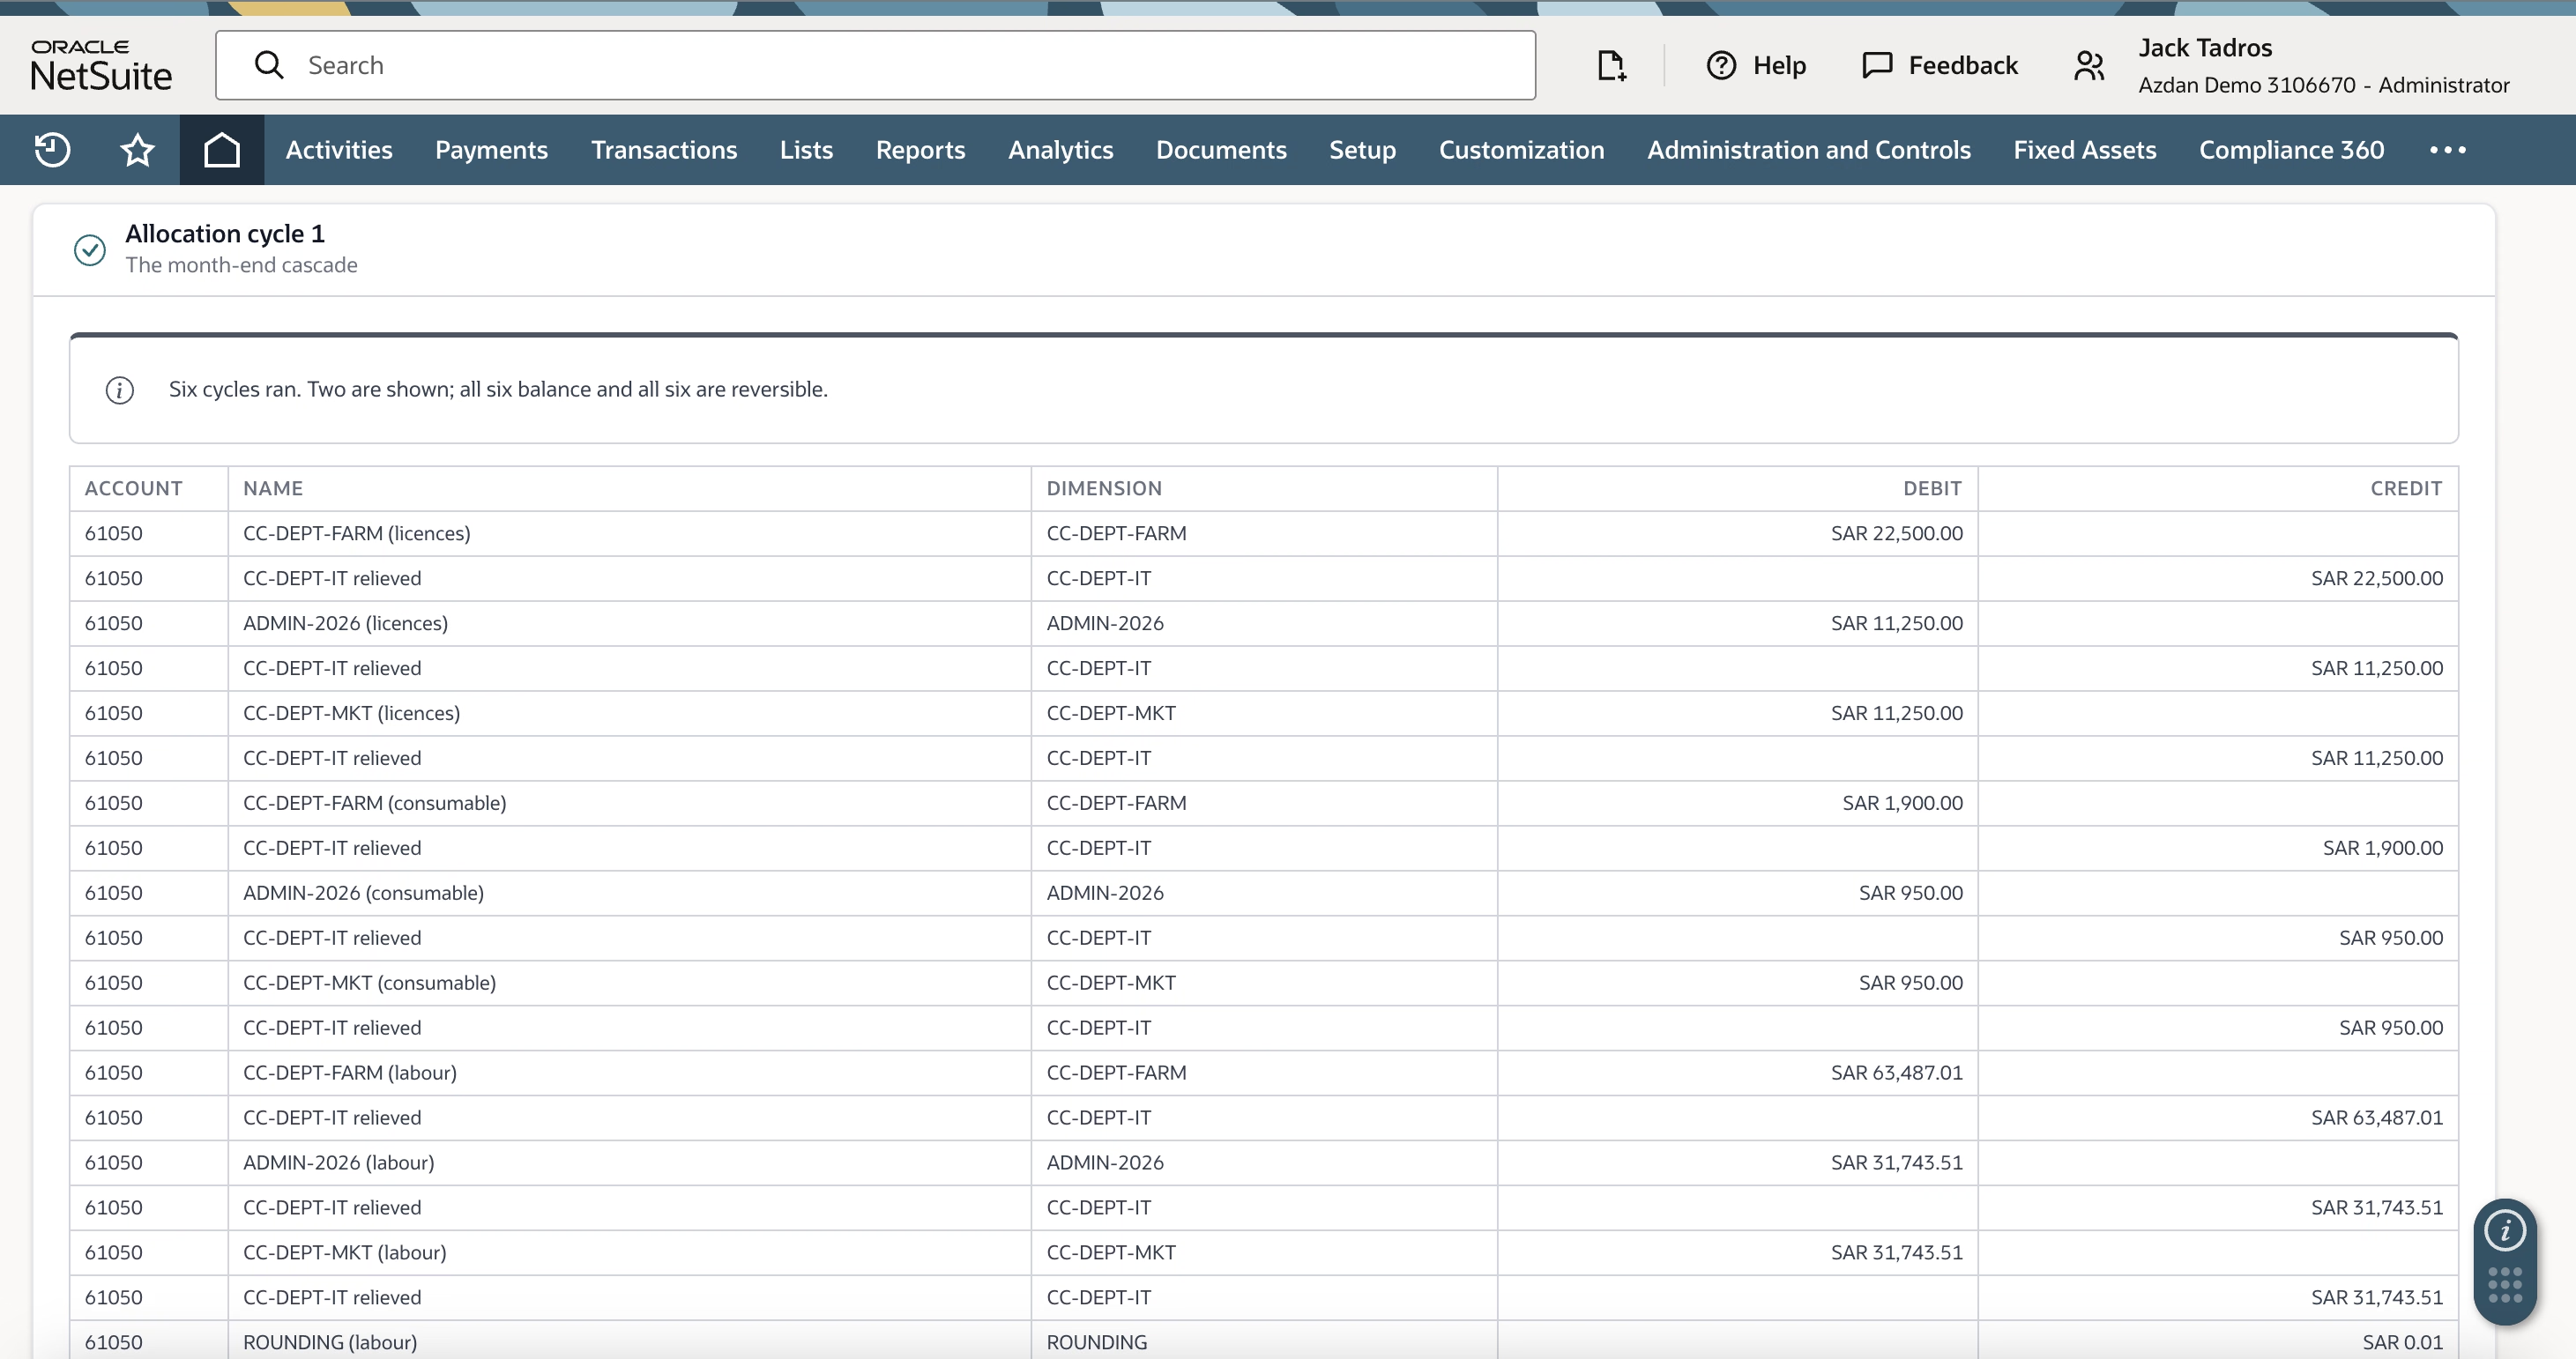
Two checks tell you the run is clean. Every intermediate cost centre should be at zero, and no amount on a final cost object should be untraceable back through the cycles. Treat either failing as a blocker rather than a rounding curiosity.
Answering the original question
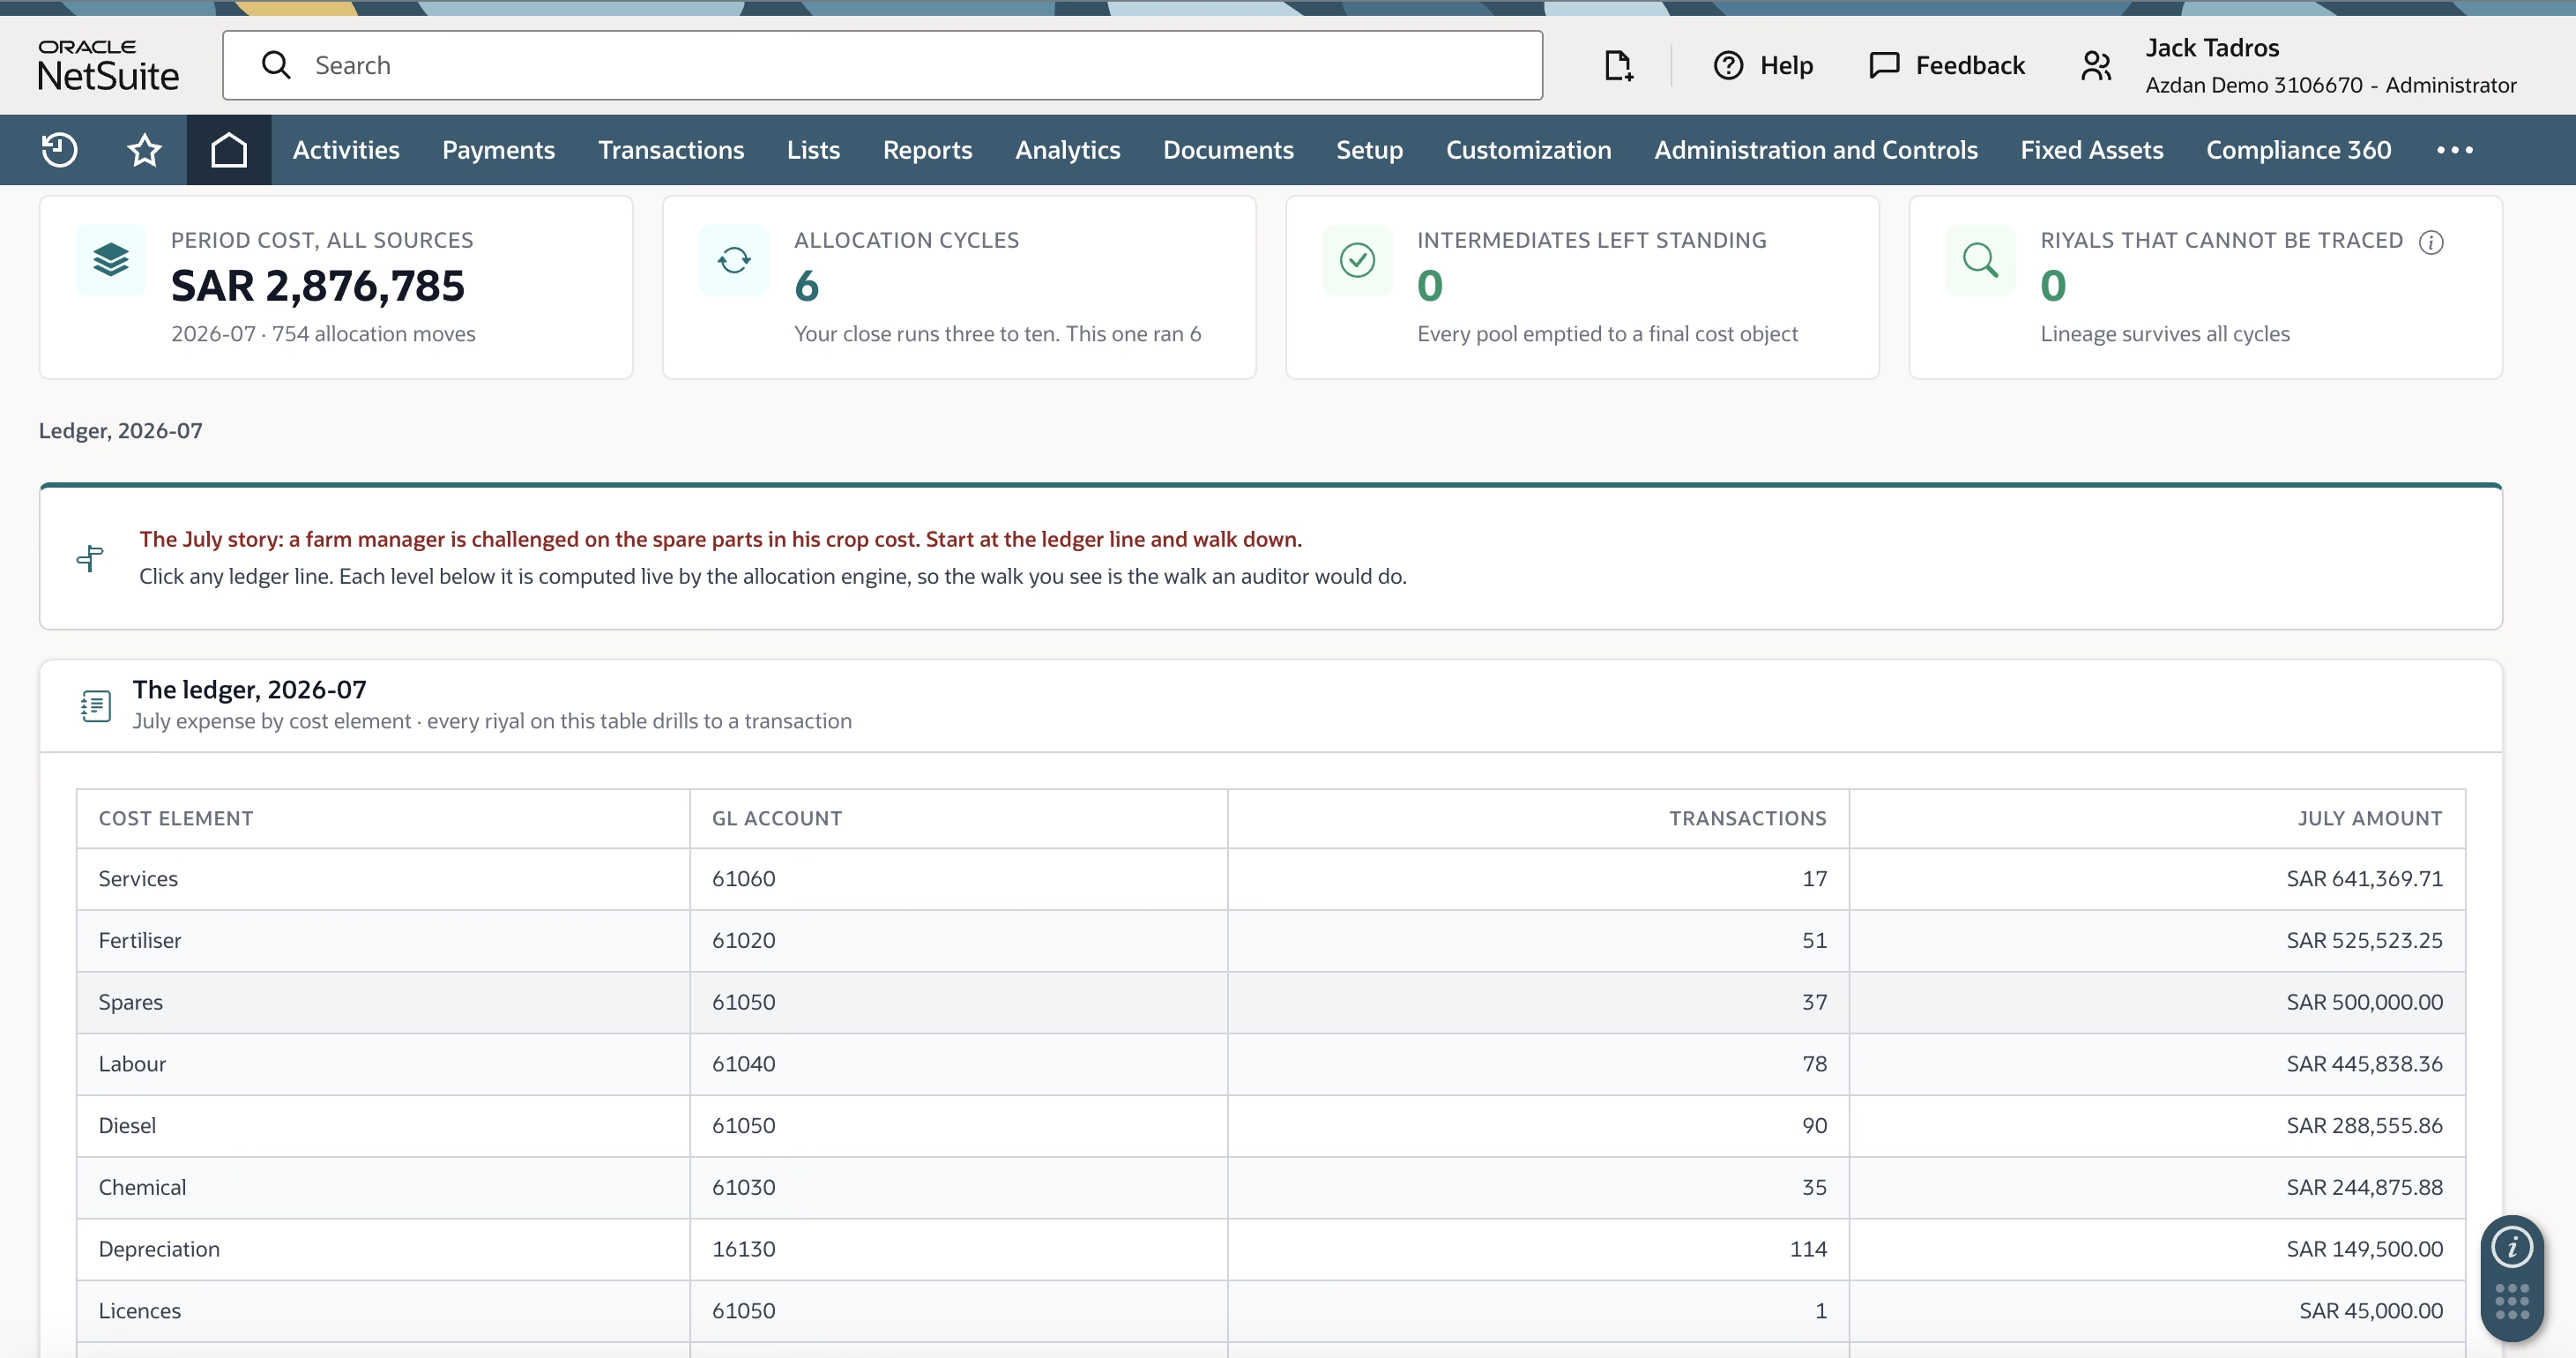
With that in place, the spare parts question takes about a minute. Open the crop's ledger line, drill to the cost centre it came from, drill again to the allocation move, and again to the transaction that created the cost. Each level is computed from the allocation data rather than stored as a snapshot, so what the farm manager sees is the same path an auditor would take.
Walk the farm managers through this drilldown during UAT rather than only training finance on it. Much of the resistance to allocated cost comes from not being able to interrogate it, and that resistance is what kills adoption of the crop P&L.
Separating what it cost to grow from what it cost to sell
Once crops carry a credible cost, a second argument usually starts. Margin is thin, and the farm team and the sales team each point at the other.
Where a farm operates that way, model each crop as two cost objects. The farm crop carries production cost: fertiliser, labour, spares, diesel, chemicals, depreciation. The marketing crop carries selling cost: commission, transport, allocated marketing overhead, samples. Both are produced by the same close, so the numbers are consistent with each other.
The question then becomes which of the two is out of line against plan, which is answerable. This design only makes sense where the two functions are genuinely accountable separately. On a farm where the same team grows and sells, it adds structure without adding insight, and it should be left out.
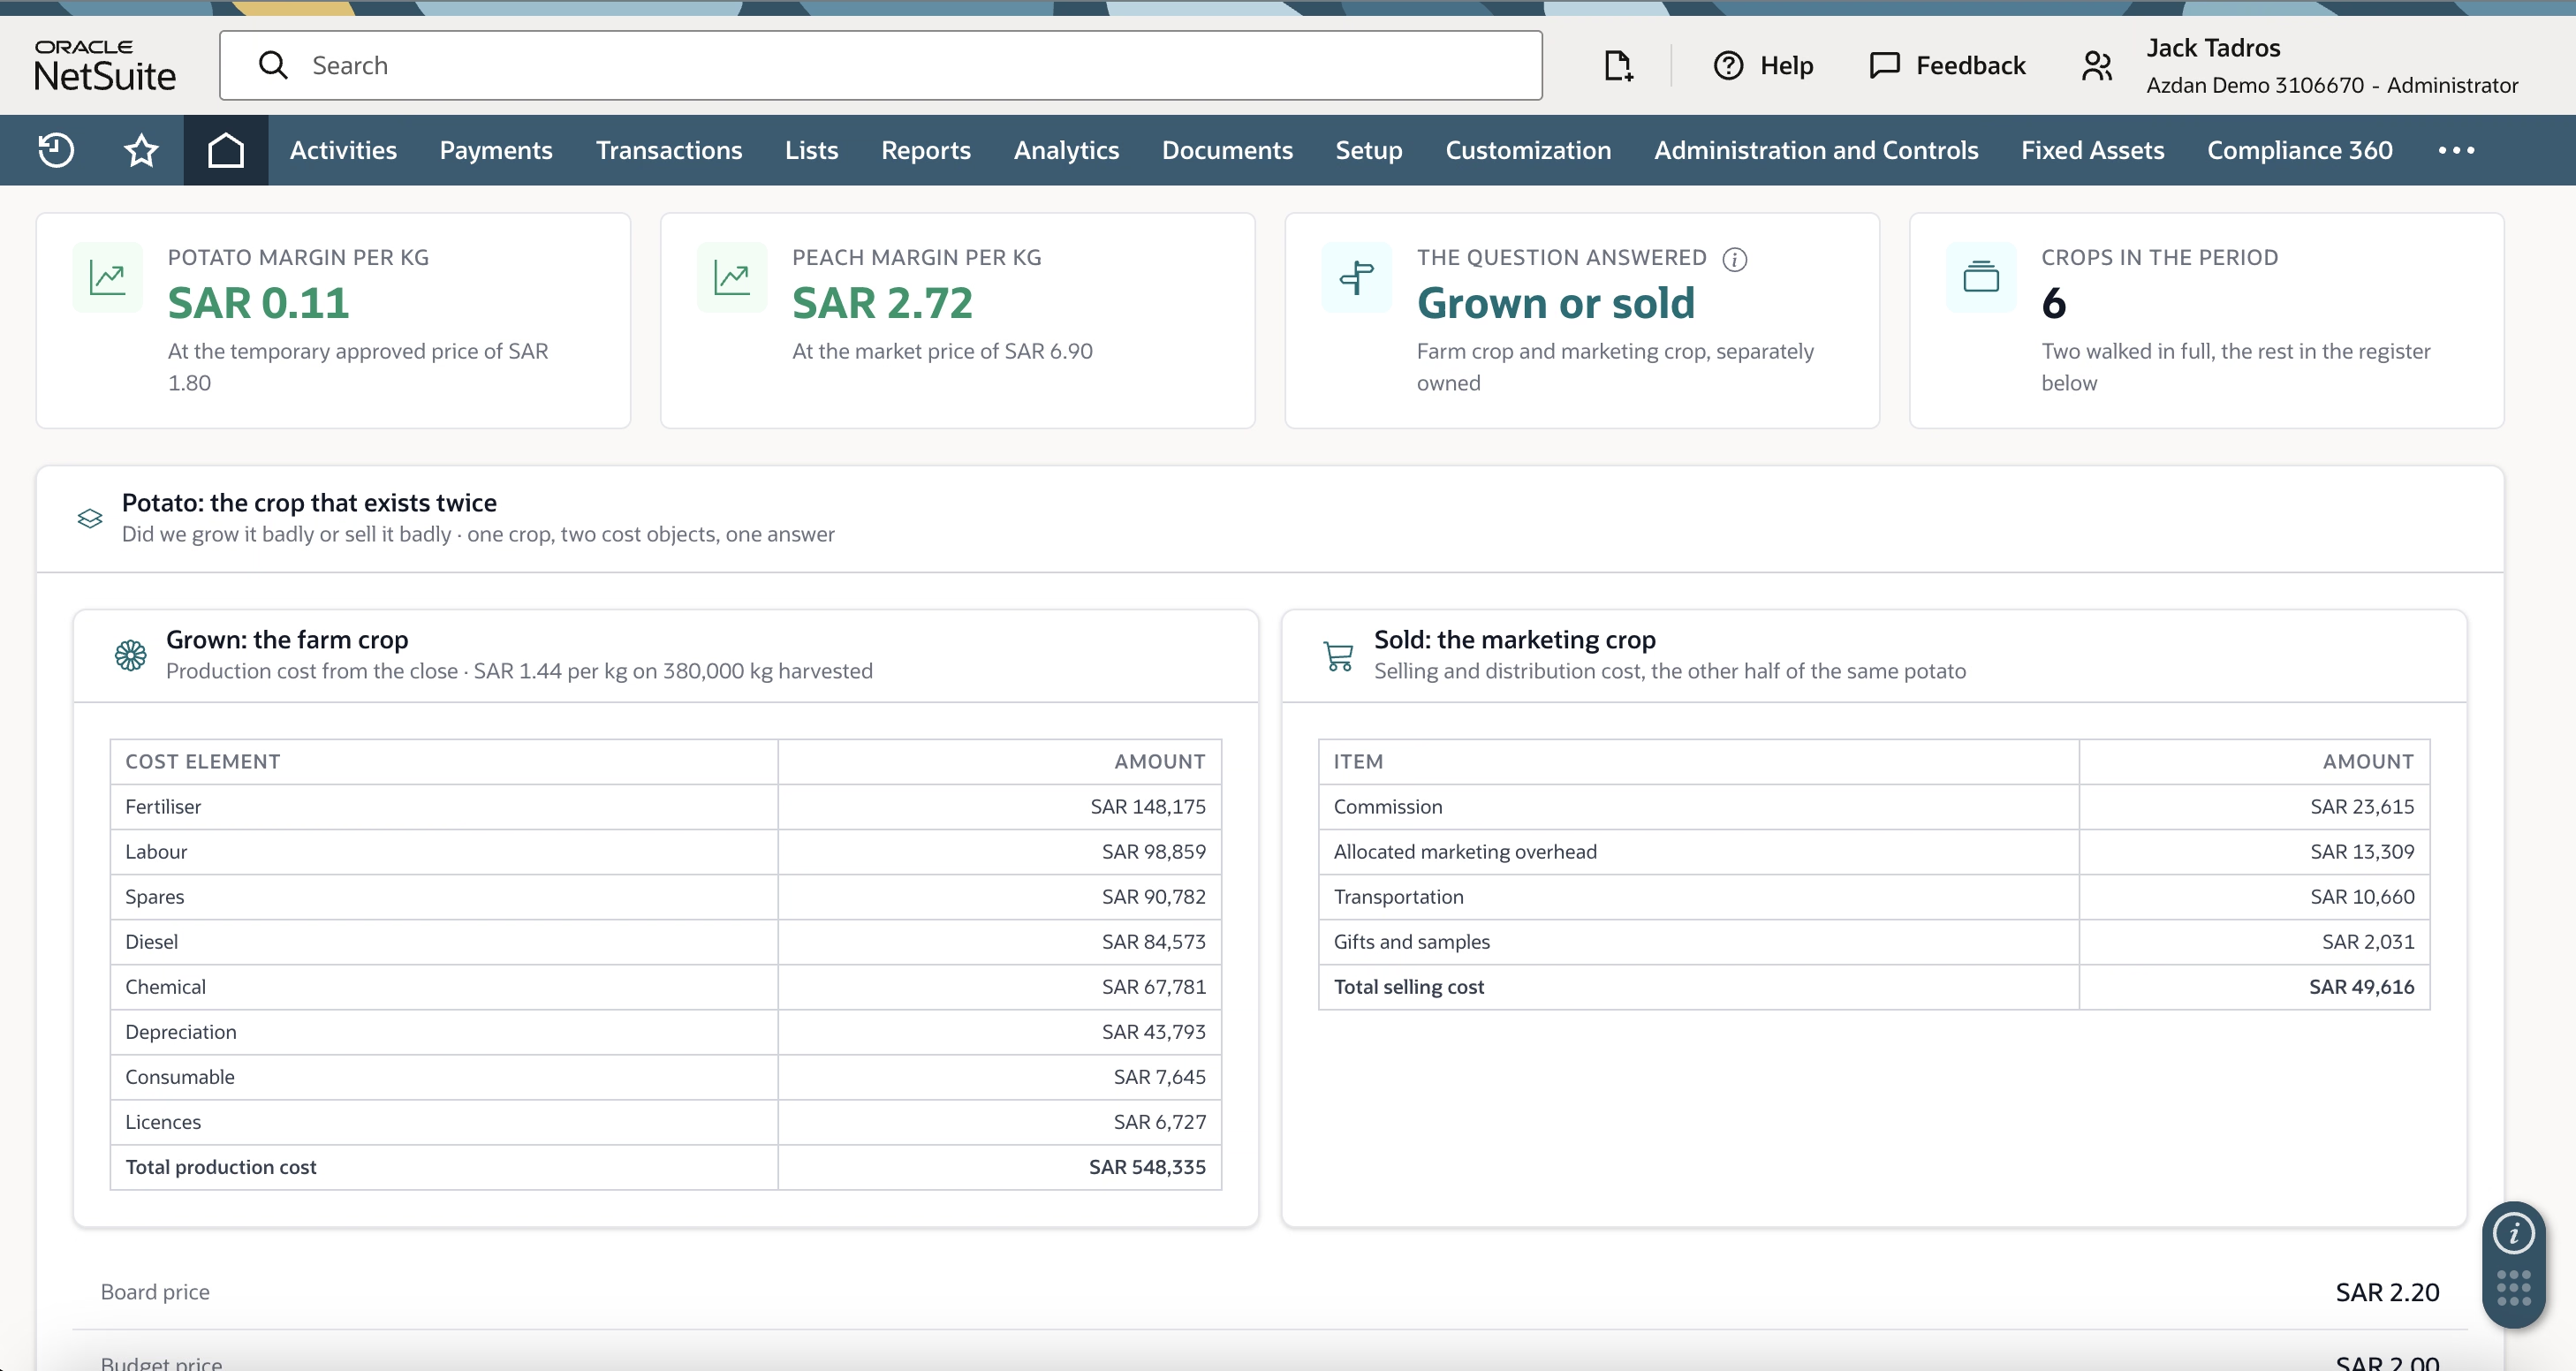
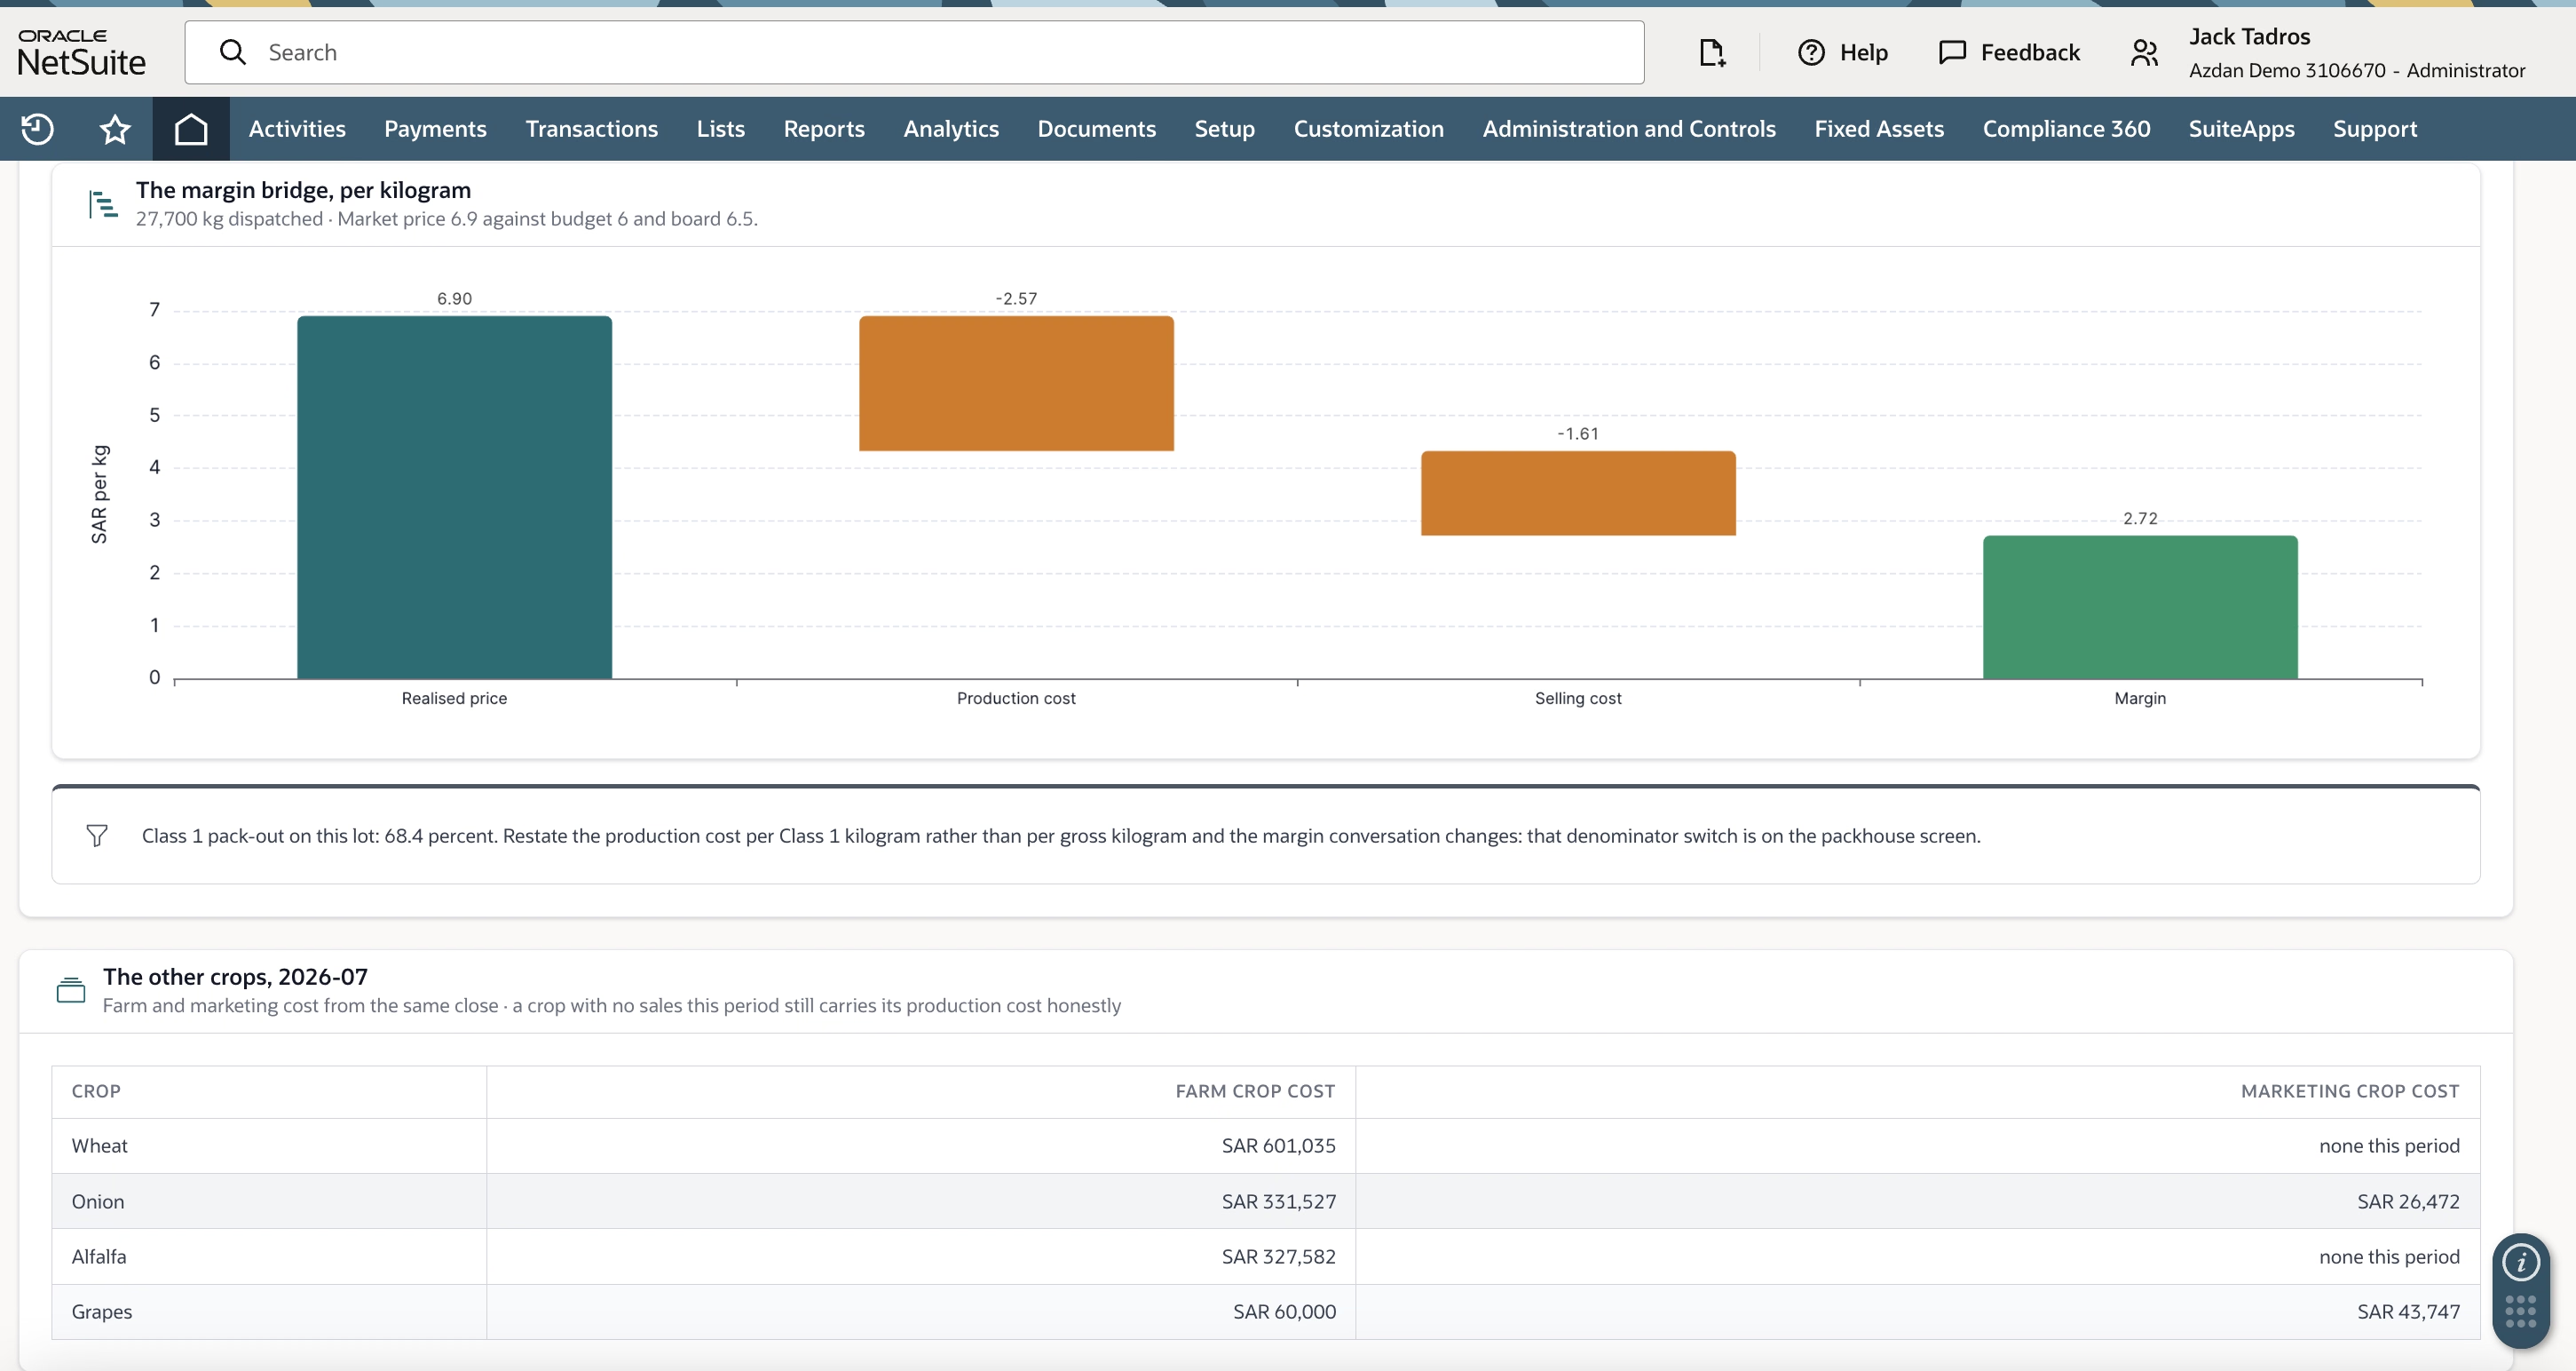
Alongside that, a bridge from realised price through production cost and selling cost to margin per kilogram gives management something readable in a board pack without a walkthrough. A crop with no sales in the period still carries its production cost rather than dropping out of the report, which is worth explaining to anyone who expects revenue and cost to appear together.
Budget control on inputs, where standard checks tend to misfire
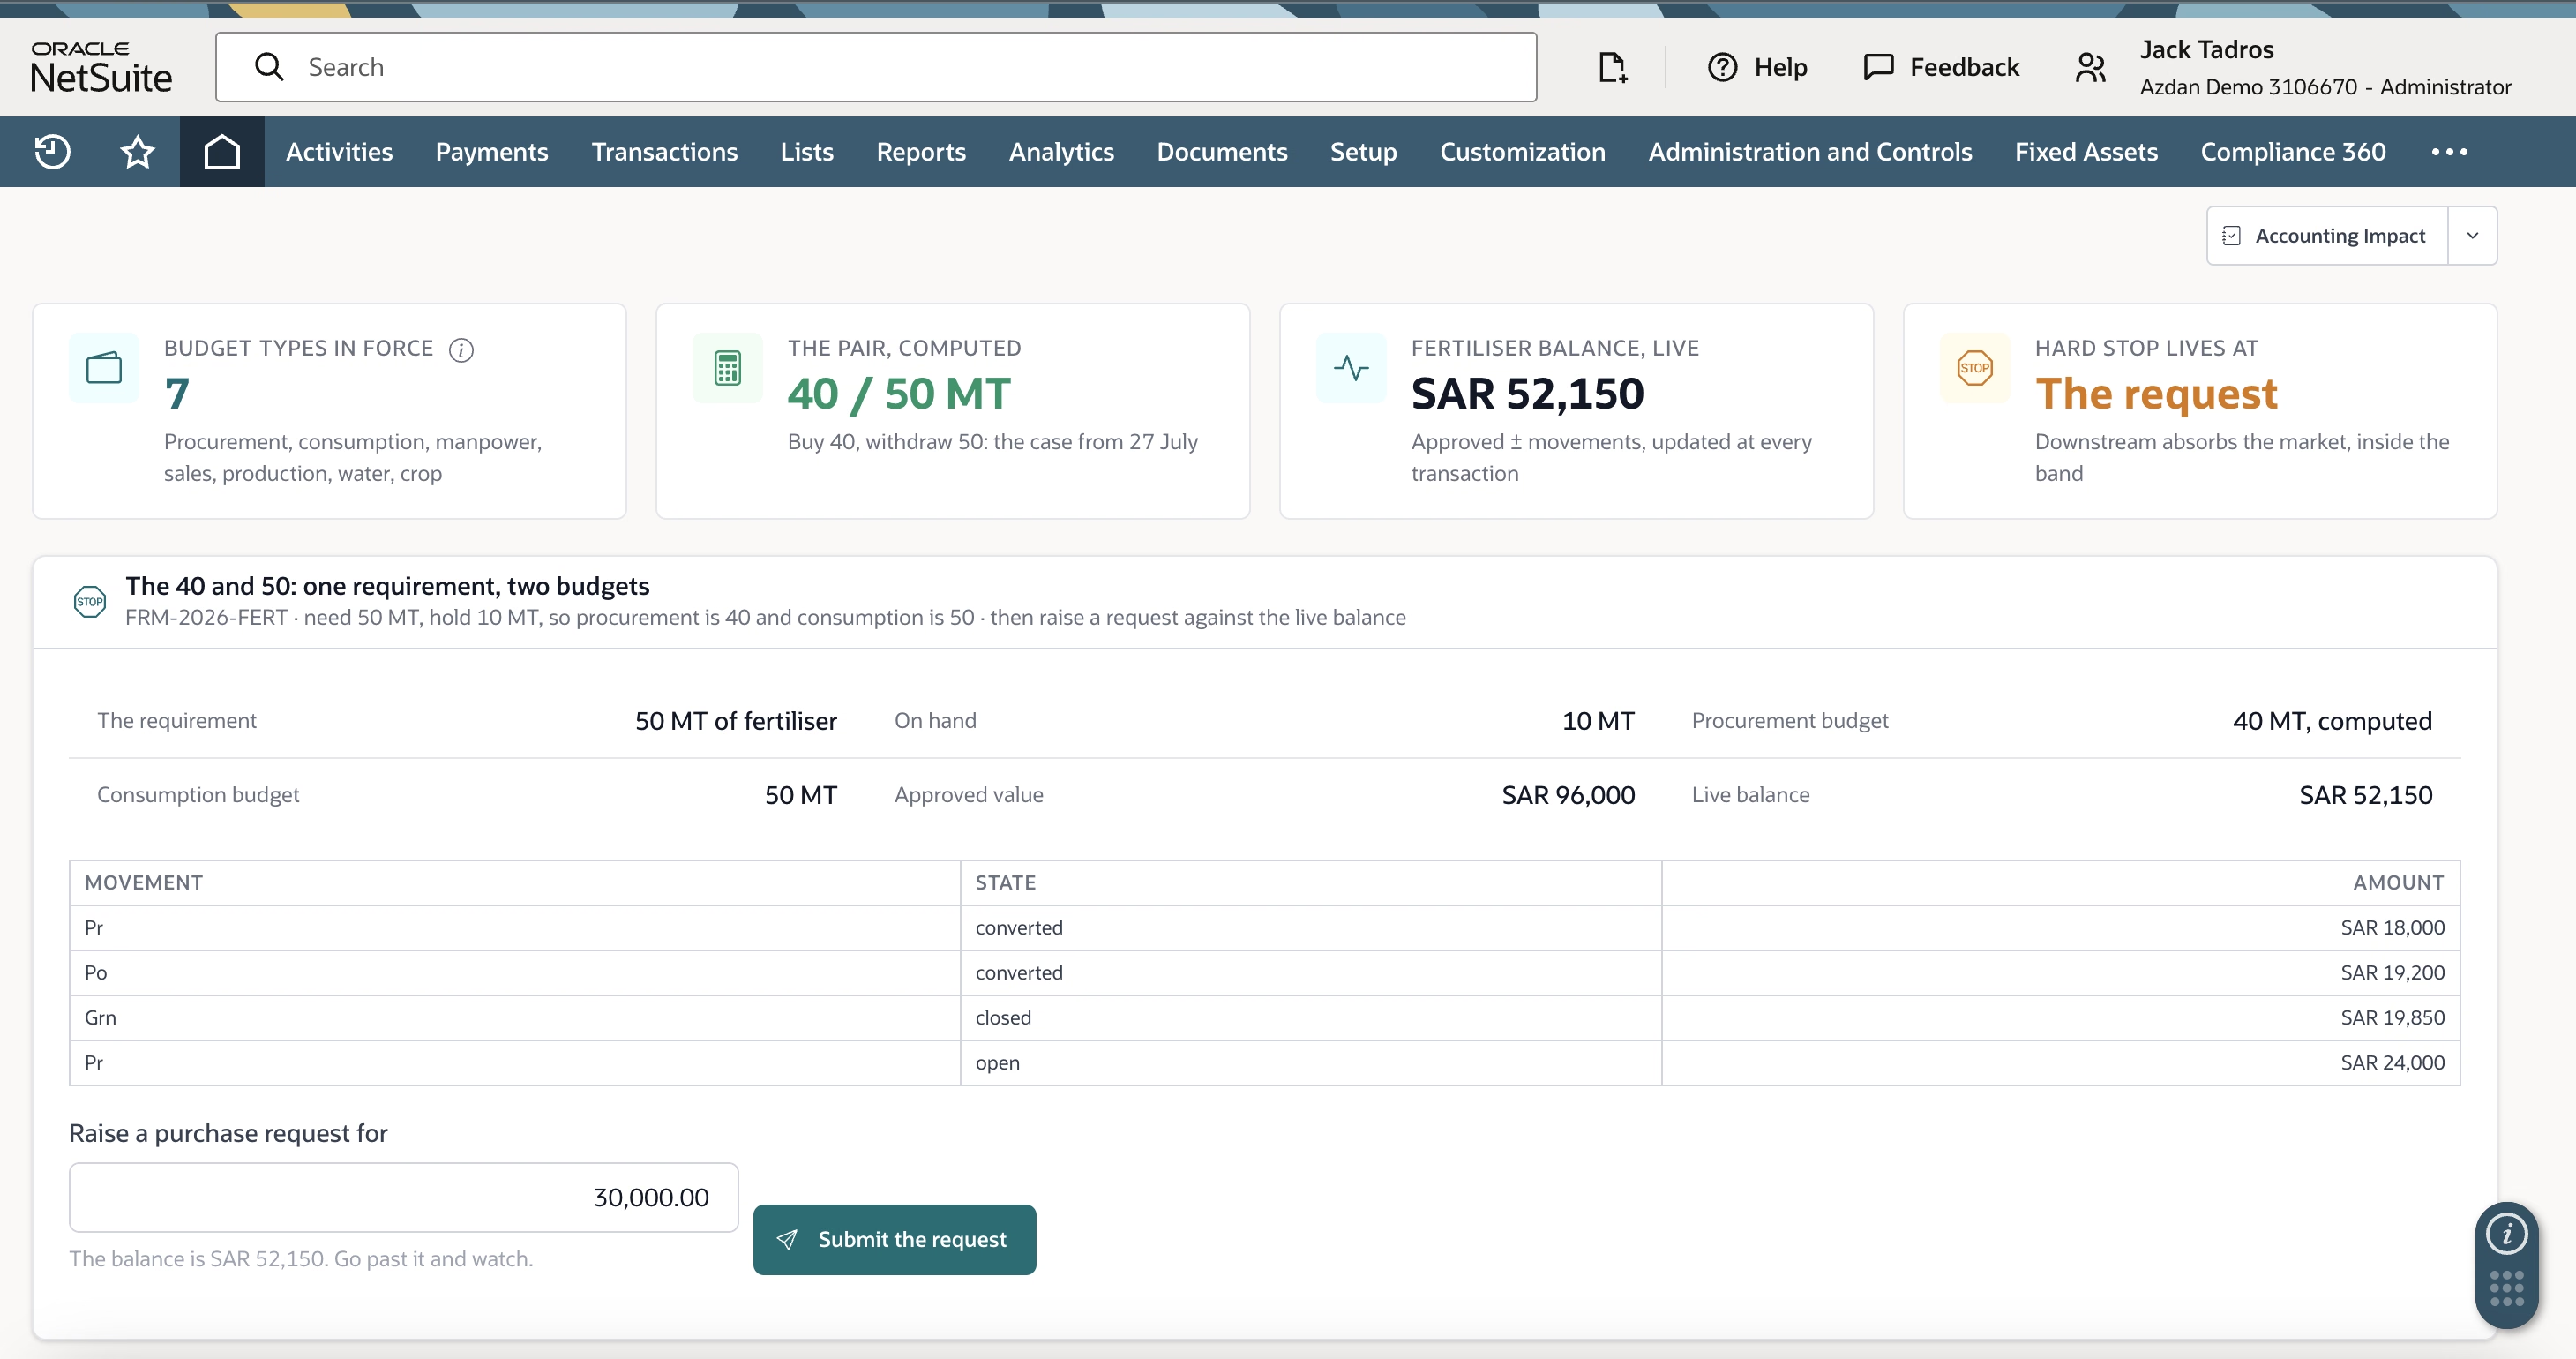
Input budgeting has a quirk that catches out generic budget validation. If the season requires 50 tonnes of fertiliser and 10 are already in store, the procurement budget is 40 tonnes while the consumption budget is 50. Treating them as one figure either blocks legitimate withdrawals from stock or allows over-purchasing, depending on which way you resolve it.
Computing the pair from the requirement and the stock position handles this. The live balance then moves with every request, order and receipt, so what a buyer sees reflects commitments rather than only posted spend.
The harder design decision is where to put the hard stop. It generally belongs at the purchase request, because that's the last point at which the business still has a genuine choice. After the order goes out, price movement is largely market-driven, so it's more practical to let the order and goods receipt absorb small variances within a tolerance band and route anything beyond it to finance for approval. Expect to spend real time agreeing those thresholds by category. Clients rarely have them written down anywhere.
Harvest labour and piece-rate incentives
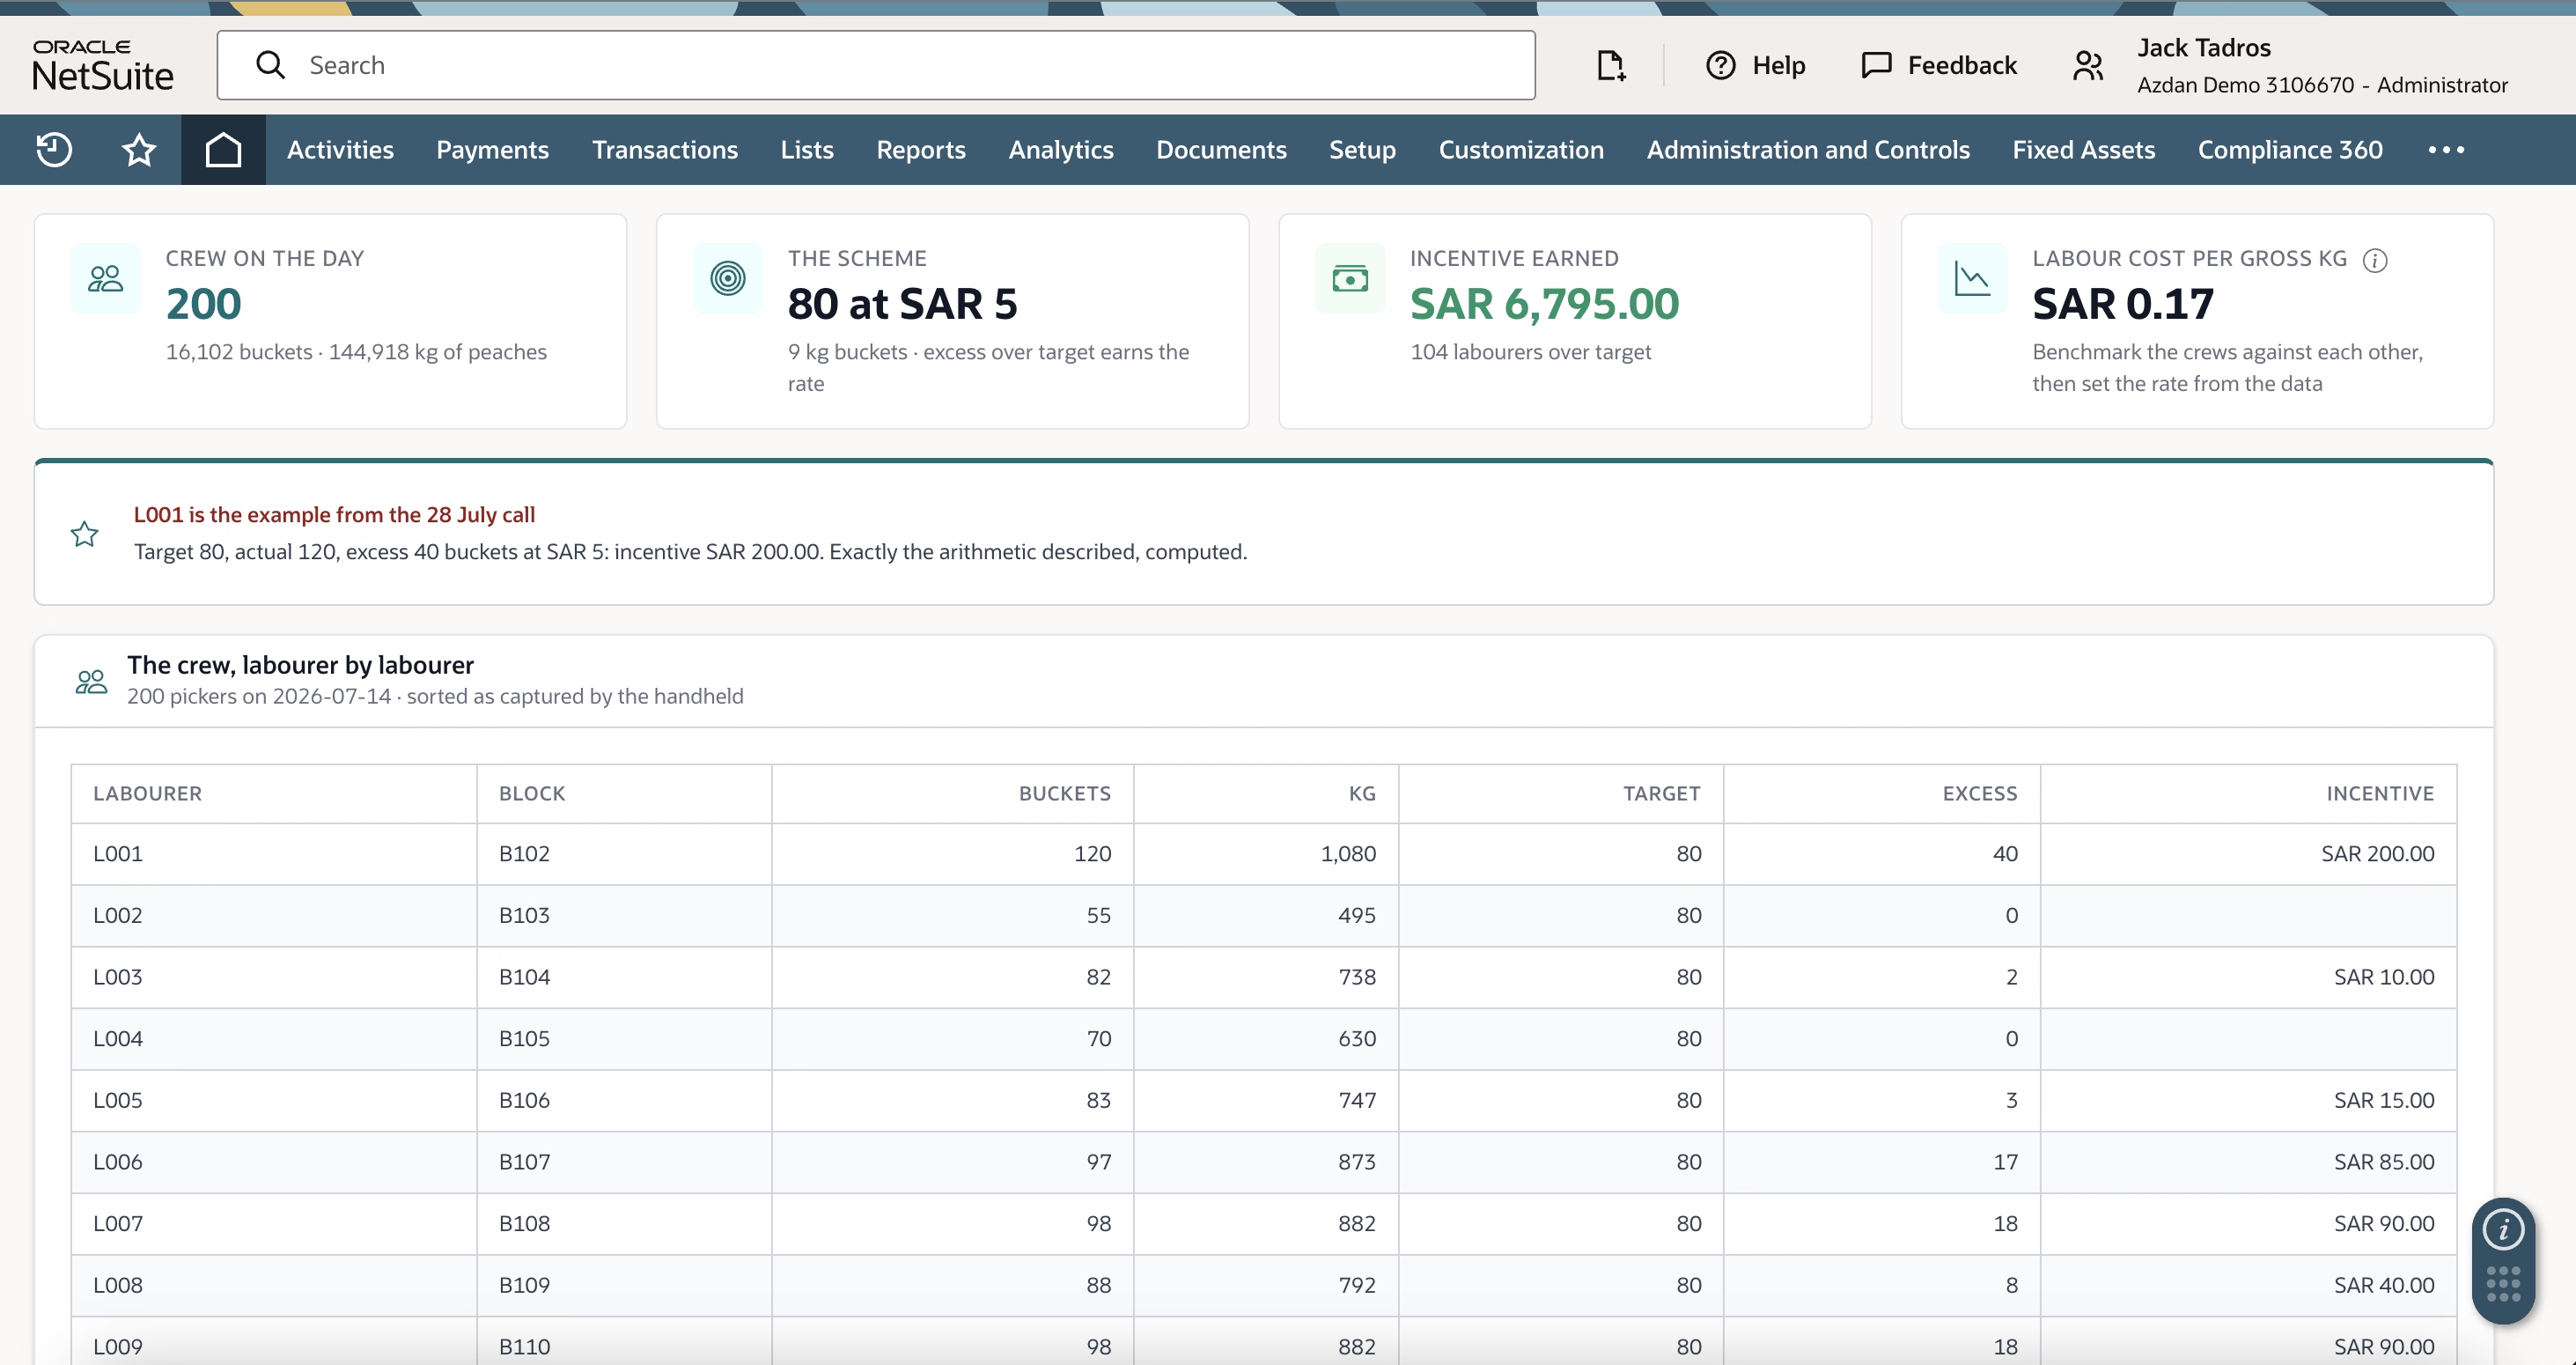
Harvest crews are commonly paid a base rate plus an incentive for output above a daily target, for example a bucket target per picker with a fixed rate per bucket above it. Where the counting is done on paper, the incentive is calculated in a spreadsheet, disputed by the crew, and reaches finance too late to be useful for anything.
Capturing buckets per picker at the block lets the scheme calculate itself, and the same records feed both payroll and the crop cost centre. The longer-term benefit is the dataset it builds. After a season you have labour cost per kilogram by crew and by block, which is what you need to set next year's rate and target from evidence rather than by repeating last year's numbers.
Pack-out and spoilage in the packhouse
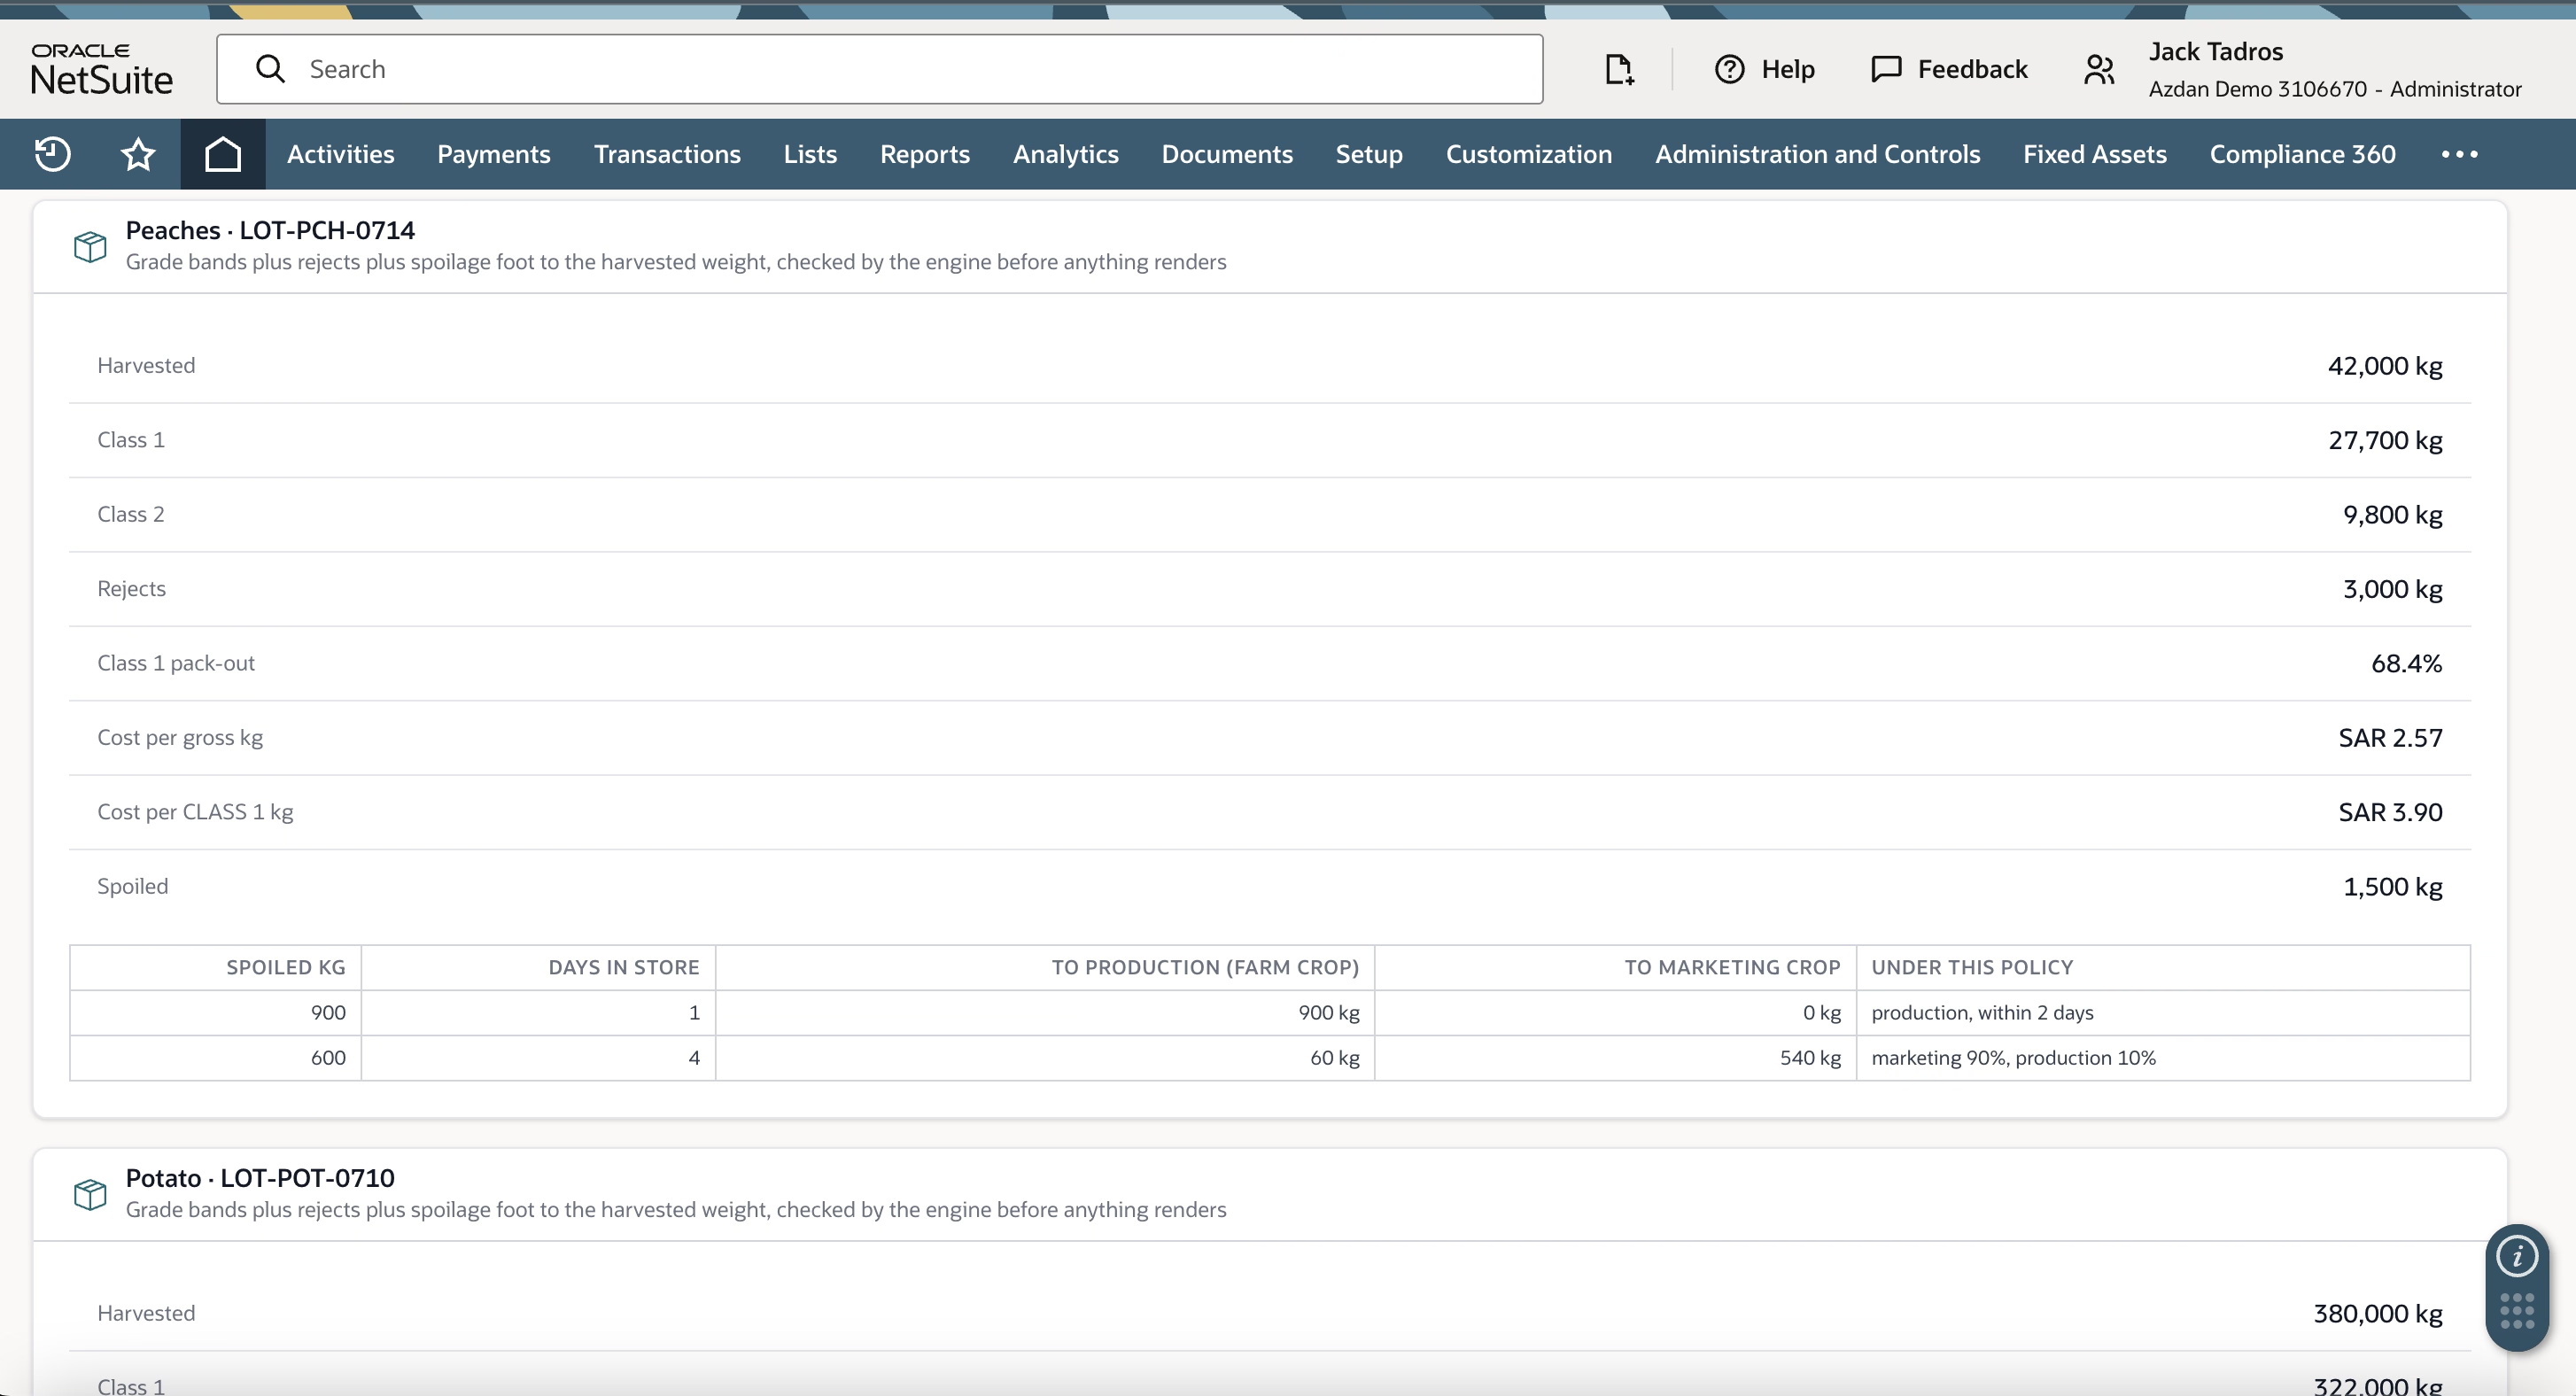
Once produce reaches the packhouse it gets graded, some is rejected, and some spoils in storage. Cost per gross kilogram is the figure most systems report, but it understates what the sellable product costs. Cost per top-grade kilogram is the number commercial teams should be pricing against, and the gap between the two widens quickly when pack-out drops.
Spoilage needs an agreed policy on who carries it. A common split is that produce spoiling within a day or two of harvest is a production loss, while produce that spoils after several days in store is mostly a marketing loss. The specific thresholds matter less than having them written into the system, since that's what stops the discussion being reopened each month.
One point worth watching during configuration: agree early whether pack-out percentage is calculated against harvested weight including spoilage or against graded weight only. Both are defensible, but a system that uses one for the percentage and the other for the unit cost will produce two figures that don't reconcile, and someone will eventually notice in a board meeting.
Traceability and recall
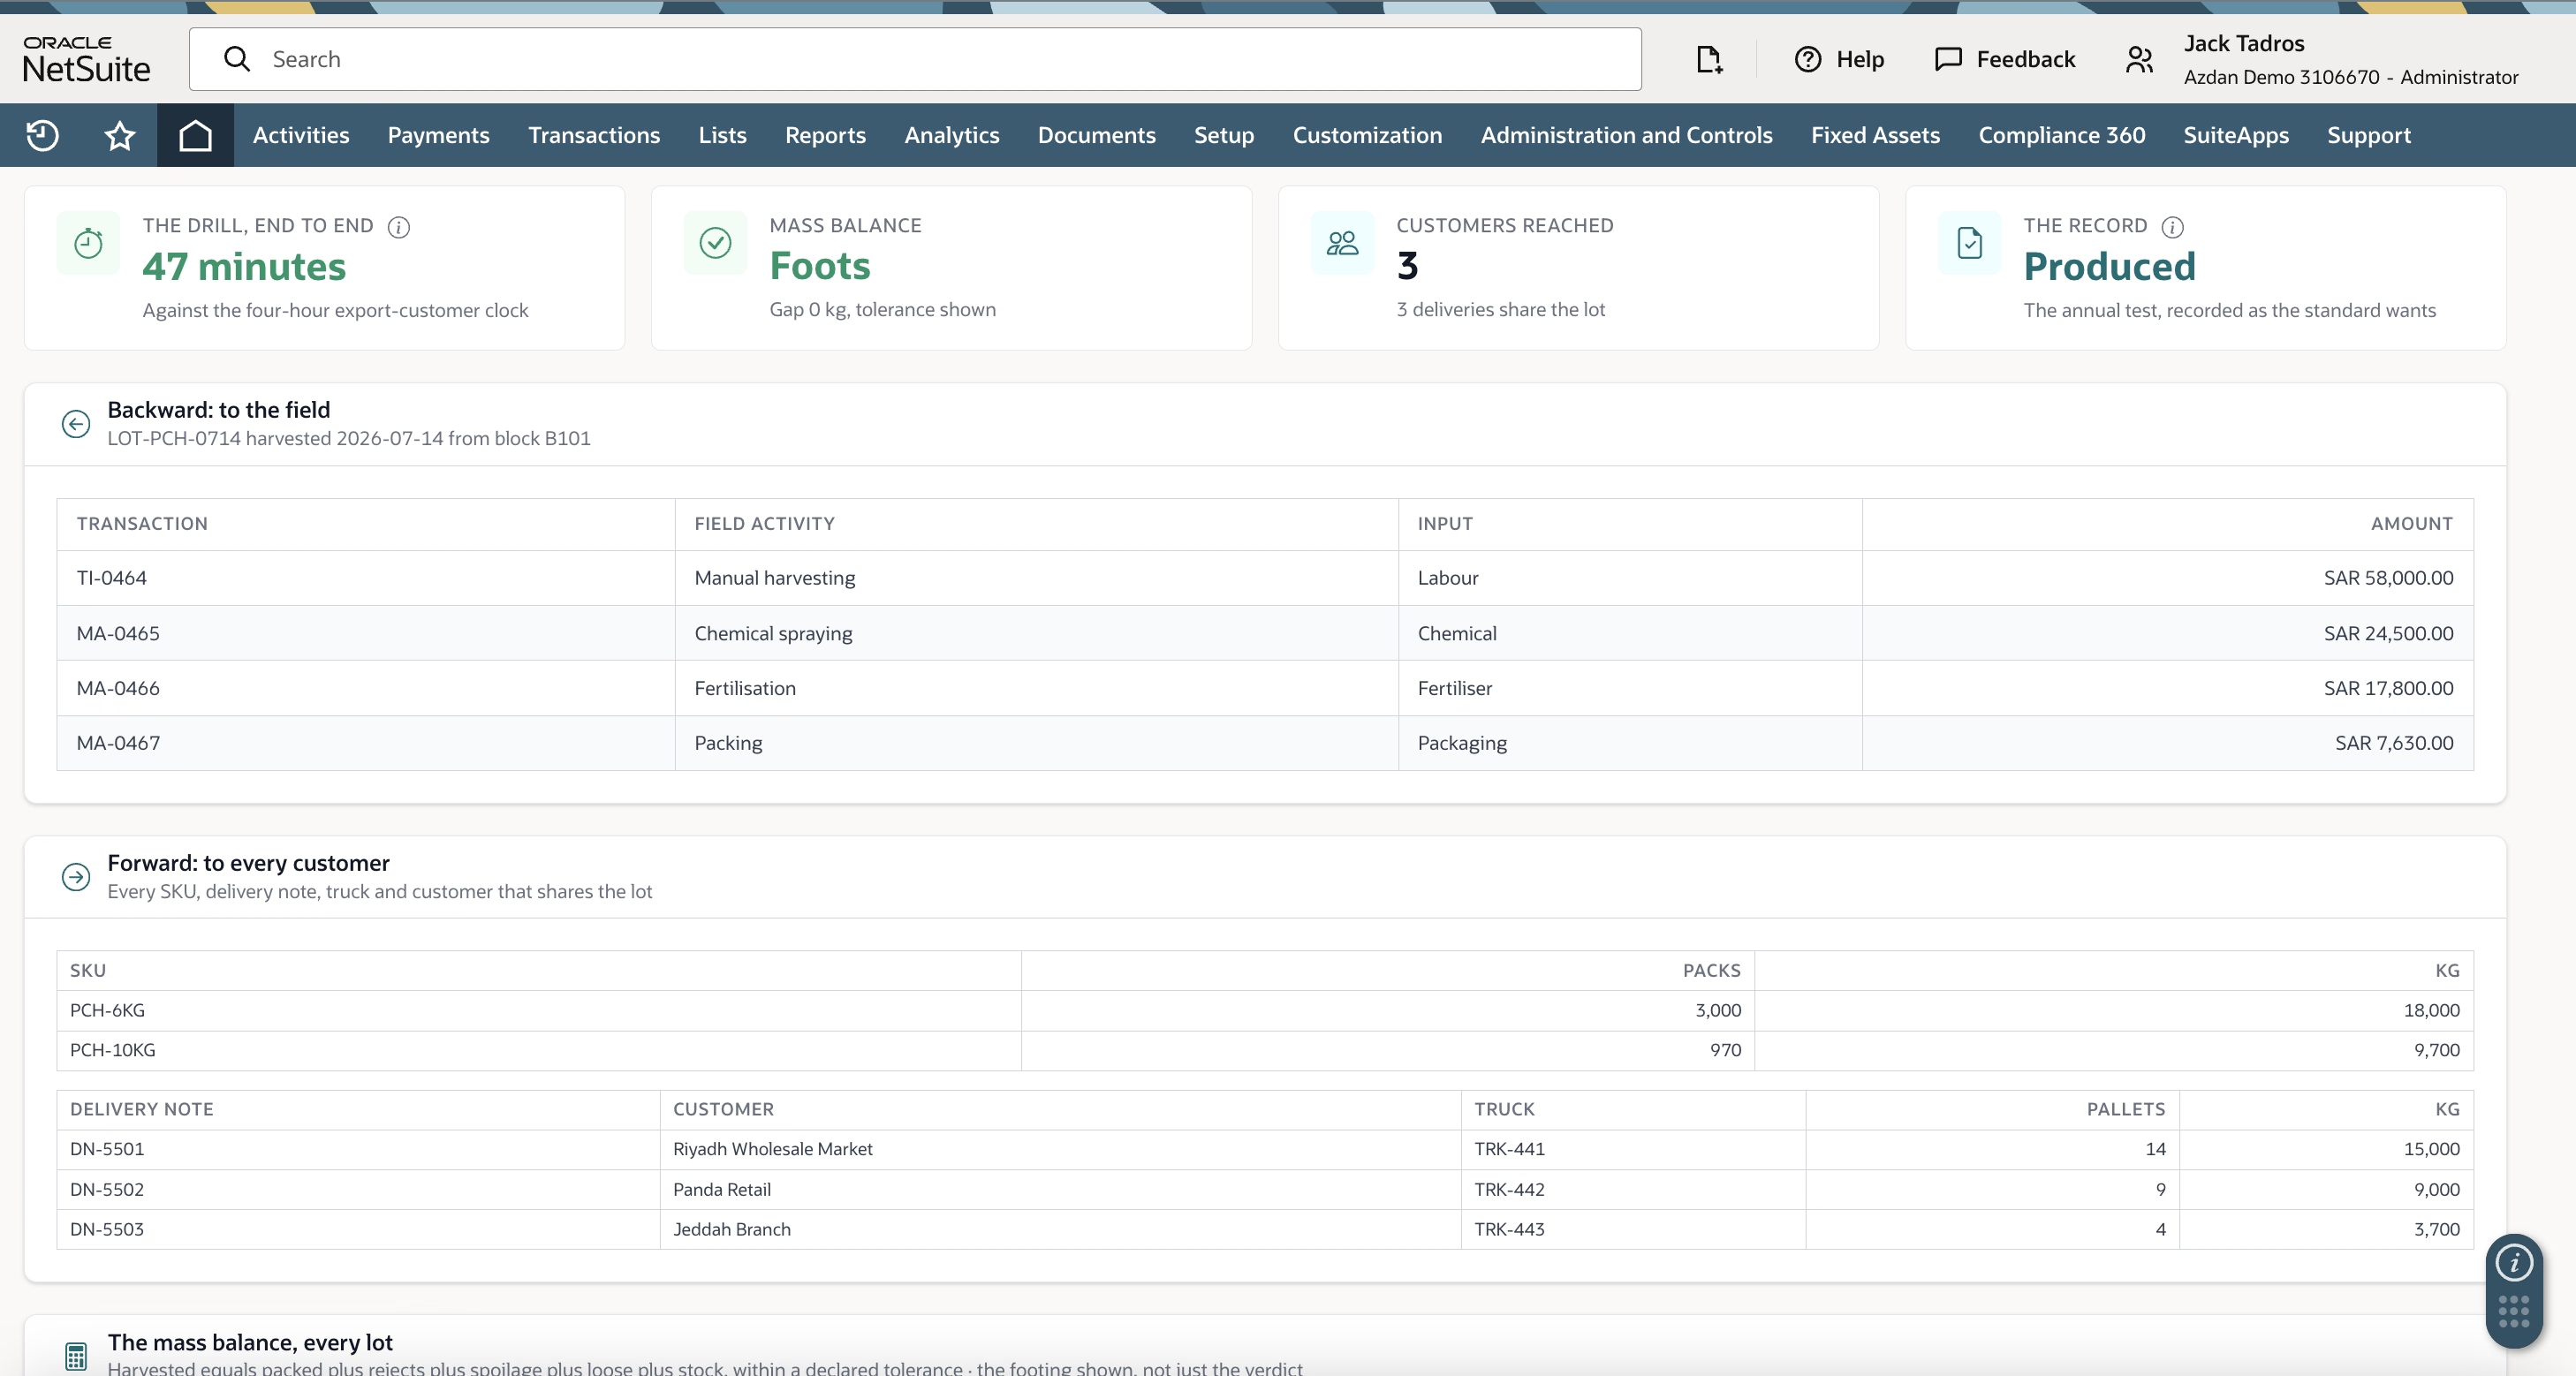
If a customer reports a problem with a lot, the trace needs to run both ways. Backward from the lot to its block, harvest date and every field activity that touched it. Forward to every SKU, delivery note, truck and customer that received part of it.
A mass balance check underpins this: harvested weight should equal packed, rejected, spoiled and remaining stock within a declared tolerance. Where it doesn't, the trace is incomplete and the recall is unreliable, so it's better to surface the gap than to report a clean result.
Export customers frequently specify a maximum trace time, often a few hours. Running a documented mock recall annually and recording the elapsed time is usually what auditors want to see, and it's straightforward to build into the system rather than treating it as an offline exercise.
Orchards, bearer plants and the replant decision
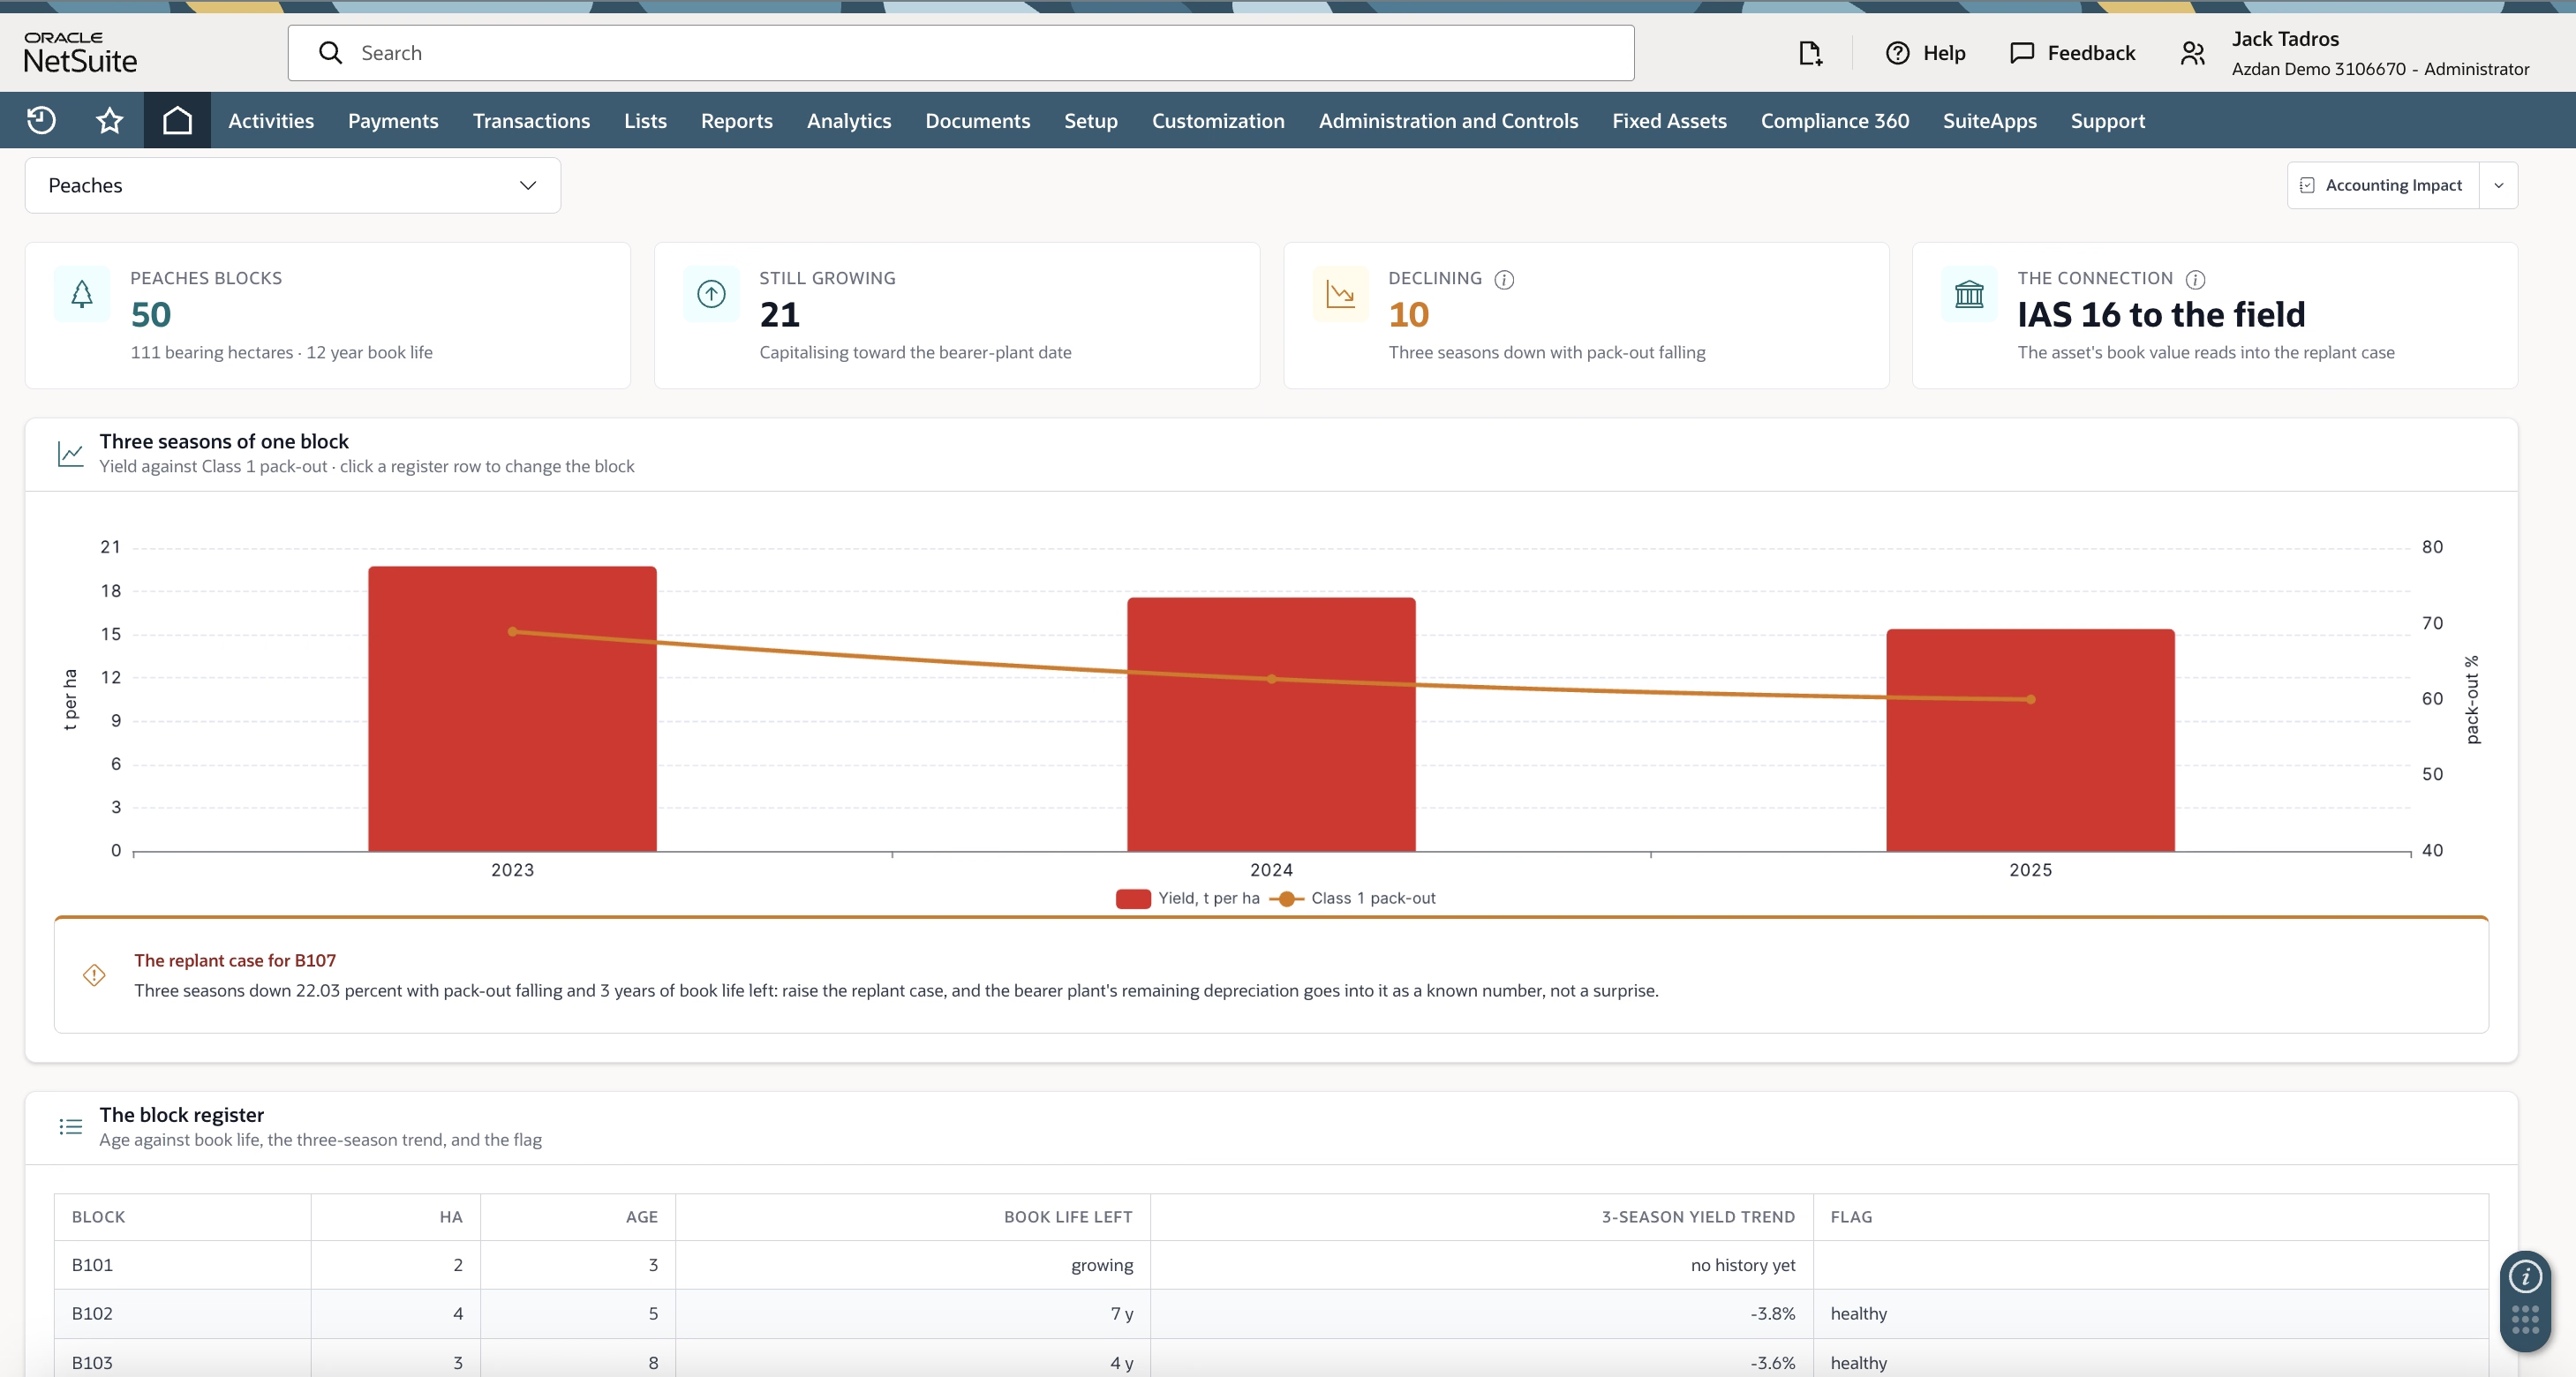
For permanent crops, the accounting treatment under IAS 16 is settled. The trees are property, plant and equipment, capitalised while immature and depreciated once bearing, with the fruit treated as produce. Configuring that in fixed assets is routine.
What's usually missing is the connection back to field performance. A block register holding age, remaining book life, multi-season yield trend and pack-out lets the replant question be raised from data. Where a block has declined over several seasons and still has book life remaining, the remaining net book value becomes a known input to the replant case rather than a write-off that surprises finance the following year.
Getting the historical yield data in is often the constraint here, since it tends to live in agronomy spreadsheets with inconsistent block naming. Worth scoping that cleanup separately.
Machine cost and the own-versus-hire question
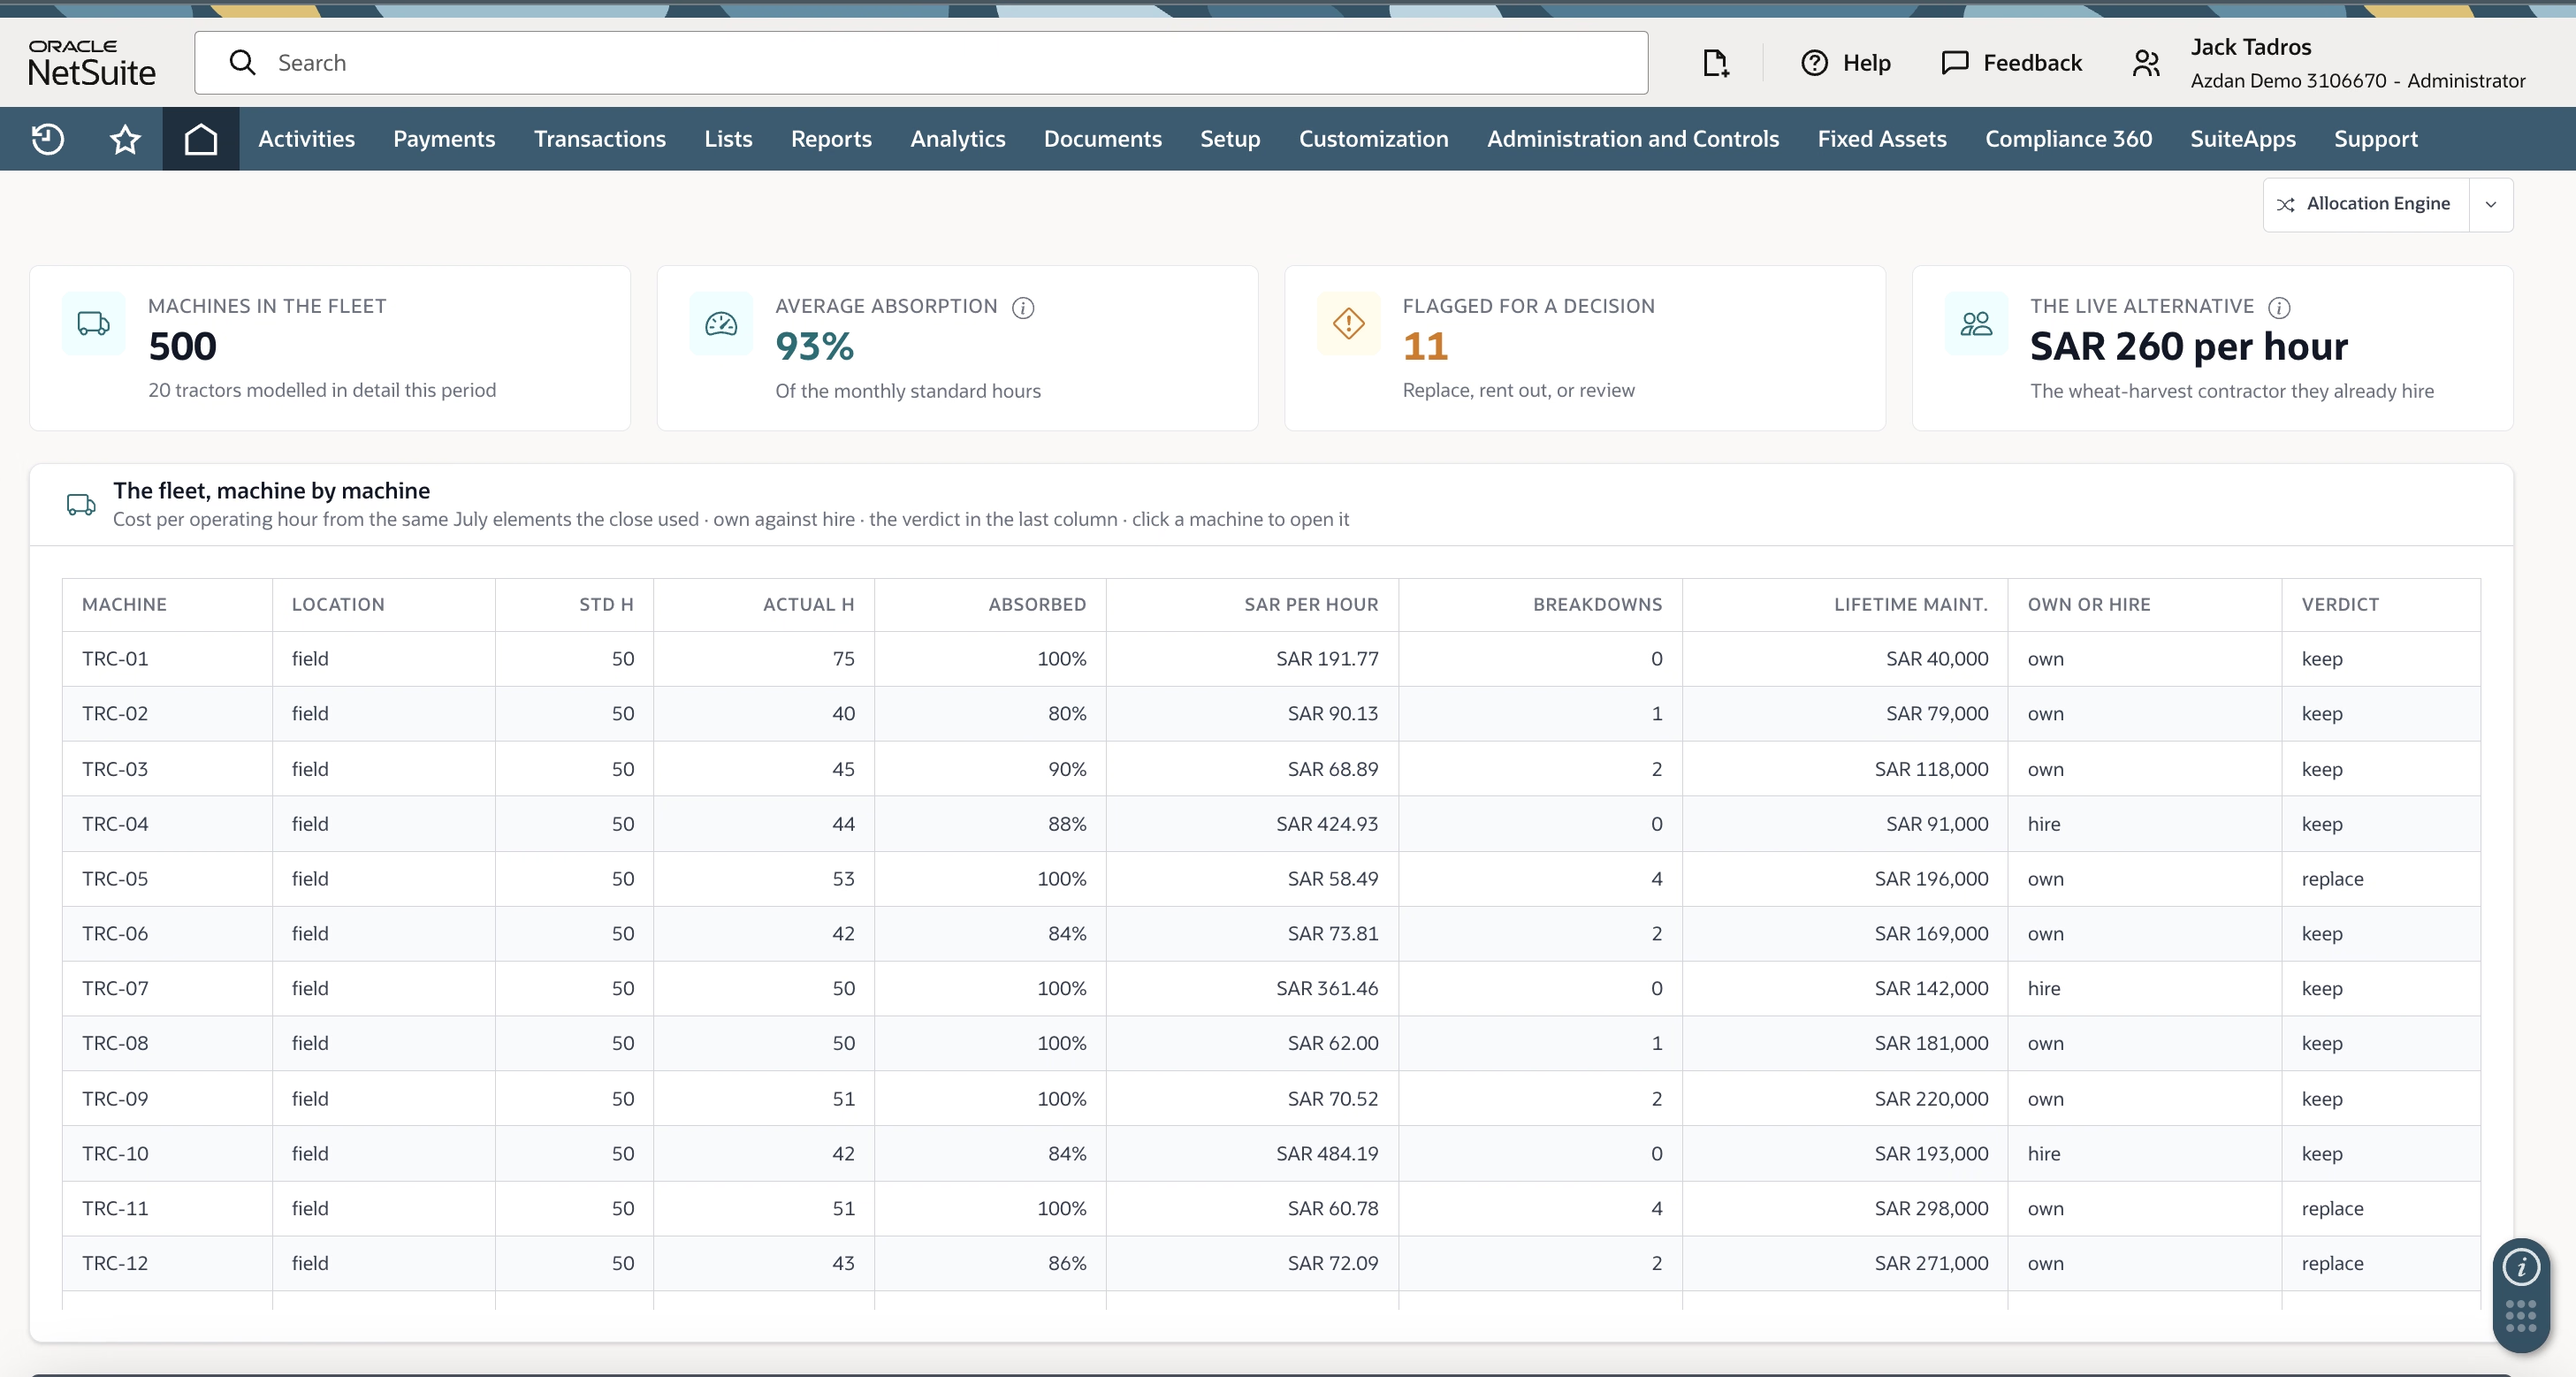
On a large farm, the fleet is significant capital and its cost is usually opaque. Cost per operating hour is the measure that makes it comparable, built from the same fuel, spares, labour and depreciation already flowing through the close, set against standard hours so absorption is visible.
Putting a contractor's hourly rate alongside it turns own-versus-hire into arithmetic rather than opinion. In practice the verdict shouldn't rest on cost per hour alone. A machine running cheaply but breaking down repeatedly is often the stronger replacement candidate, since the breakdown cost lands elsewhere as delayed operations and lost yield. Build the decision rule with operations, and make the logic visible on screen so people can see why a machine was flagged.
Planning against the binding constraint
Crop plans are almost always built per hectare. Where the real constraint on the business is water rather than land, ranking crops by margin per unit of water gives a different and more useful ordering. Two crops with similar margin per hectare can differ substantially on water productivity, which changes what should be planted.
A caution on this one. If the ranking sets full-season planned revenue against period-to-date cost, the margins it produces won't reconcile with the crop P&L, and the first person to compare the two screens will stop trusting both. Use consistent bases, and label clearly whether the figure is a plan or an actual.
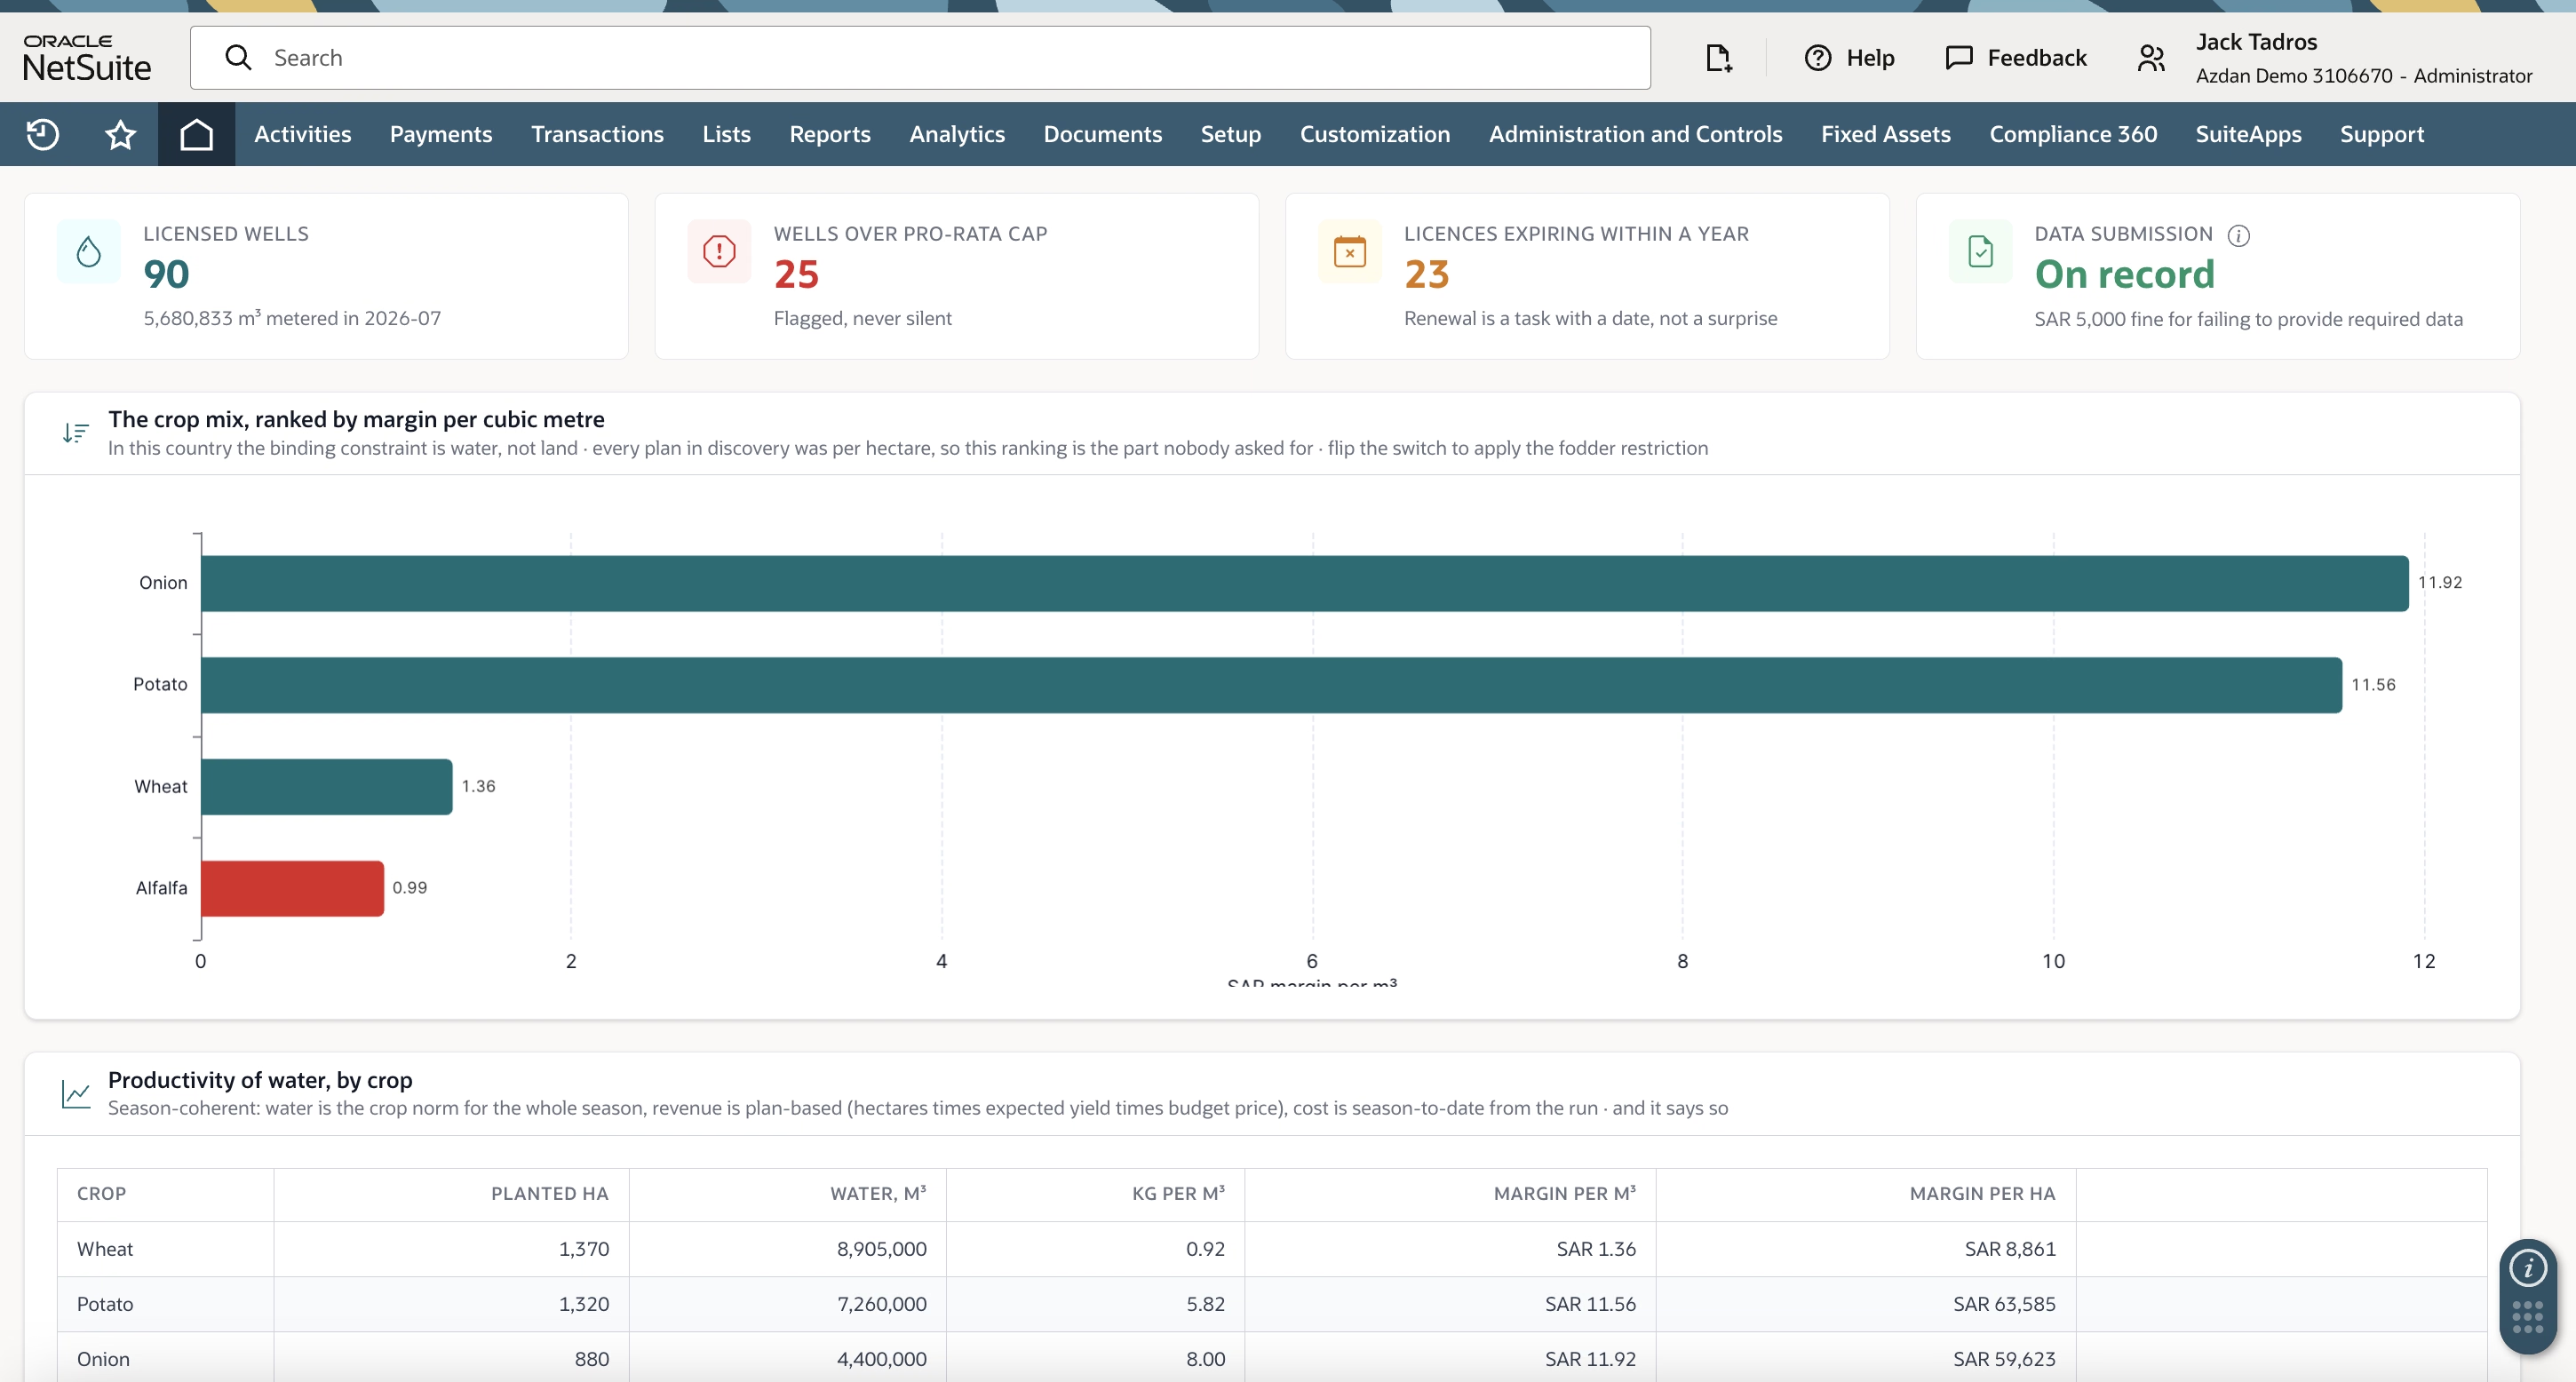
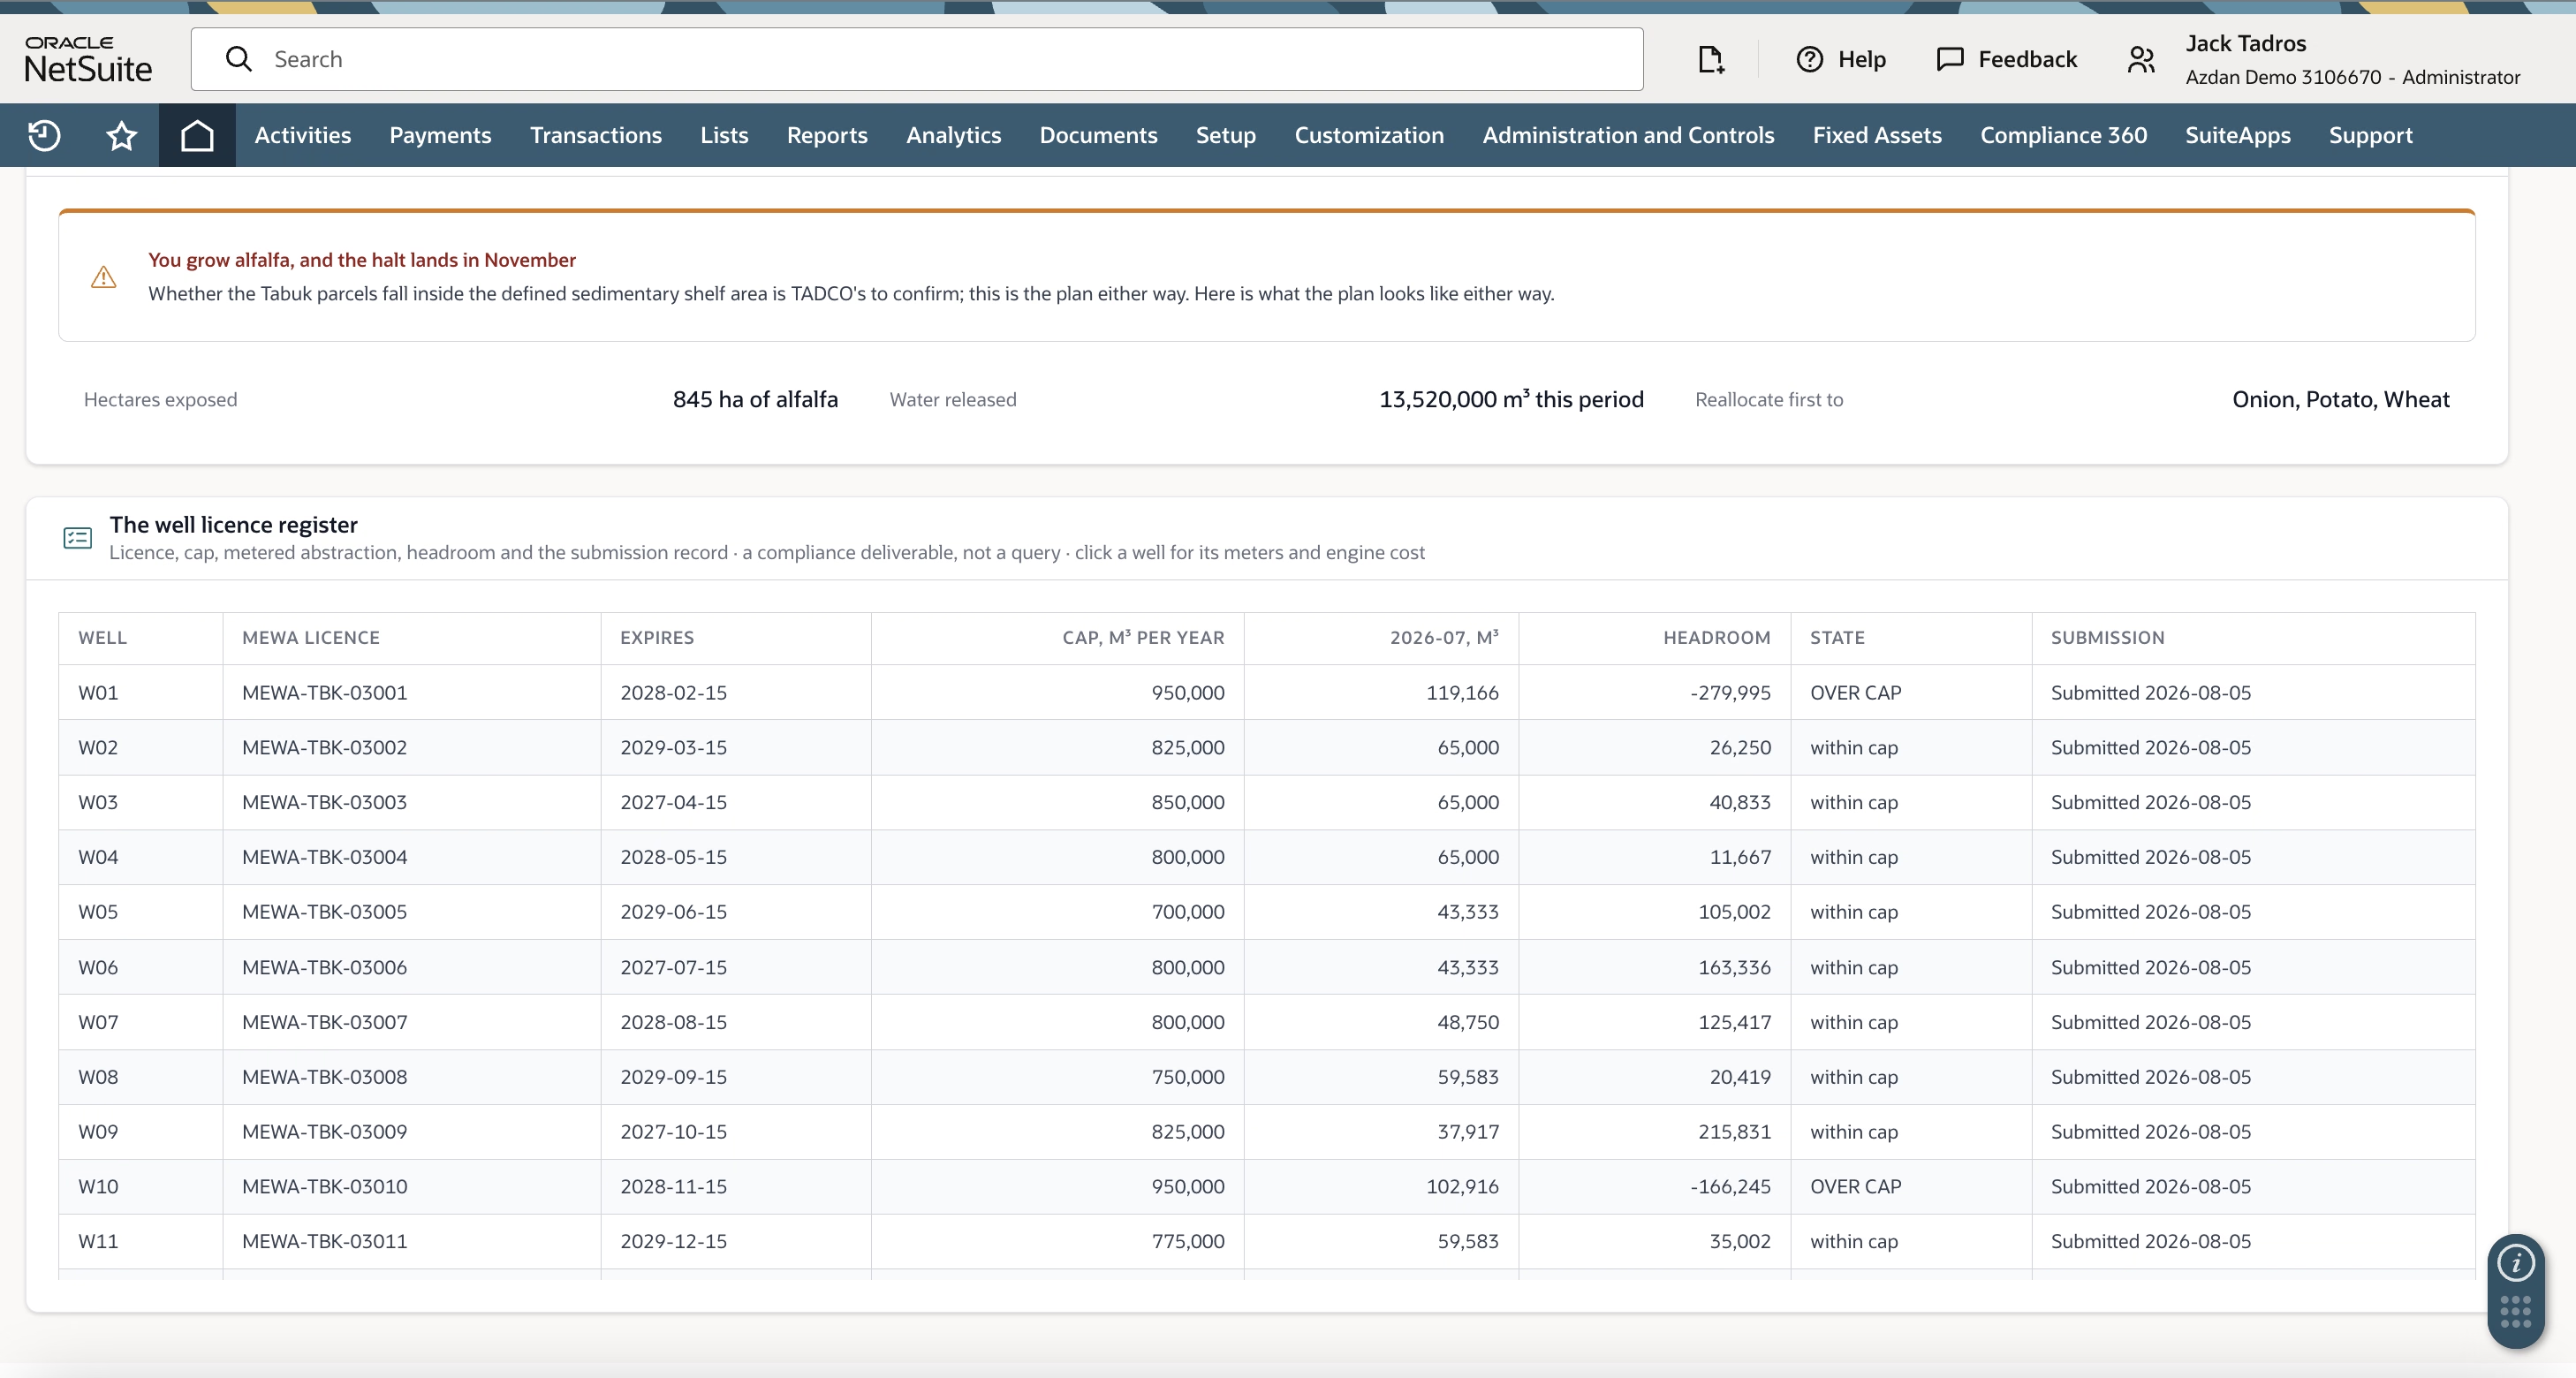
Where abstraction is licensed, the licence register belongs in the ERP rather than in a compliance folder. Holding cap, metered abstraction, headroom against a pro-rata limit, expiry date and submission record in one place means wells running over are flagged during the year rather than discovered at the end of it, and renewals become dated tasks with owners.
What makes this hold together
None of the above is a separate system. The harvest console, the packhouse screens, the fleet analysis and the crop P&L all read from the same close, which is the main argument for doing this on a single ERP rather than stitching farm management software to an accounting package.
NetSuite provides the core: multi-entity finance, fixed assets, inventory with lot tracking, procurement, budgets and allocations. The agricultural layer is configured and extended on that core rather than running beside it.
Frequently asked questions
Is NetSuite suitable for agricultural businesses?
Yes. NetSuite provides finance, inventory, procurement, fixed assets and budgeting as standard. Agriculture-specific processes such as crop costing, harvest capture, water management and block registers are configured on the platform so they share a single ledger.
How does NetSuite allocate farm overheads to crops?
Costs collect on intermediate cost centres such as departments, well engines and tractors, then allocate to crops at month end through sequenced cycles using bases like hectares, water drawn or fixed rates. Allocations are reversible and drill back to the source transaction.
Can NetSuite separate growing cost from selling cost?
Yes, by modelling each crop as both a farm crop and a marketing crop. This is worth doing where production and sales are separately accountable, and unnecessary where the same team handles both.
How does NetSuite handle bearer plants under IAS 16?
Orchard blocks are held as fixed assets, capitalised while immature and depreciated once bearing. Linking yield and pack-out history to the asset record allows replant decisions to account for remaining book value.
Does NetSuite support farm-to-customer traceability?
Yes. Lot tracking links each harvested lot backward to its field inputs and forward to every SKU, delivery and customer, supporting recall drills and mass balance verification.
How long does a NetSuite agriculture implementation take?
It depends mainly on the depth of the cost object network, the number of allocation cycles, and how much operational capture is in scope. The order matters more than the timeline: season plan and master data, cost model and allocations, then operational screens, then dashboards.
Related Azdan resources
Published by Azdan, an Oracle NetSuite Solution Provider. Guidance in this article reflects Azdan's implementation work with agricultural producers. This article is general guidance and not accounting advice; the measurement basis for your biological assets is a matter for your auditor.