.svg)


In short: A breeder ERP has to do two jobs at once. It has to record what the farm does every day — feed, mortality, eggs, insemination — and it has to turn that into a biological asset on the balance sheet under IAS 41. Most poultry software does the first job. Most ERPs do the second. This article shows how both run in one system on NetSuite, stage by stage, from chick placement to flock depletion.
A poultry group can usually tell you what a day-old chick sells for. Far fewer can tell you what one costs to make without a week of spreadsheet work. Fewer still can explain why that cost moved between May and June.
The reason is structural. The farm runs poultry software that understands hen-day production and breed standards but posts nothing to the ledger. Finance runs an ERP that understands journals but treats a flock as either stock or a lump of cost. In between sits one workbook, kept by one cost accountant, and the month-end depends on it.
This article covers three things: how IAS 41 applies to a breeder flock, what a breeder ERP has to capture to satisfy it, and how that looks running in NetSuite. The screenshots come from a working NetSuite configuration. The figures are illustrative.
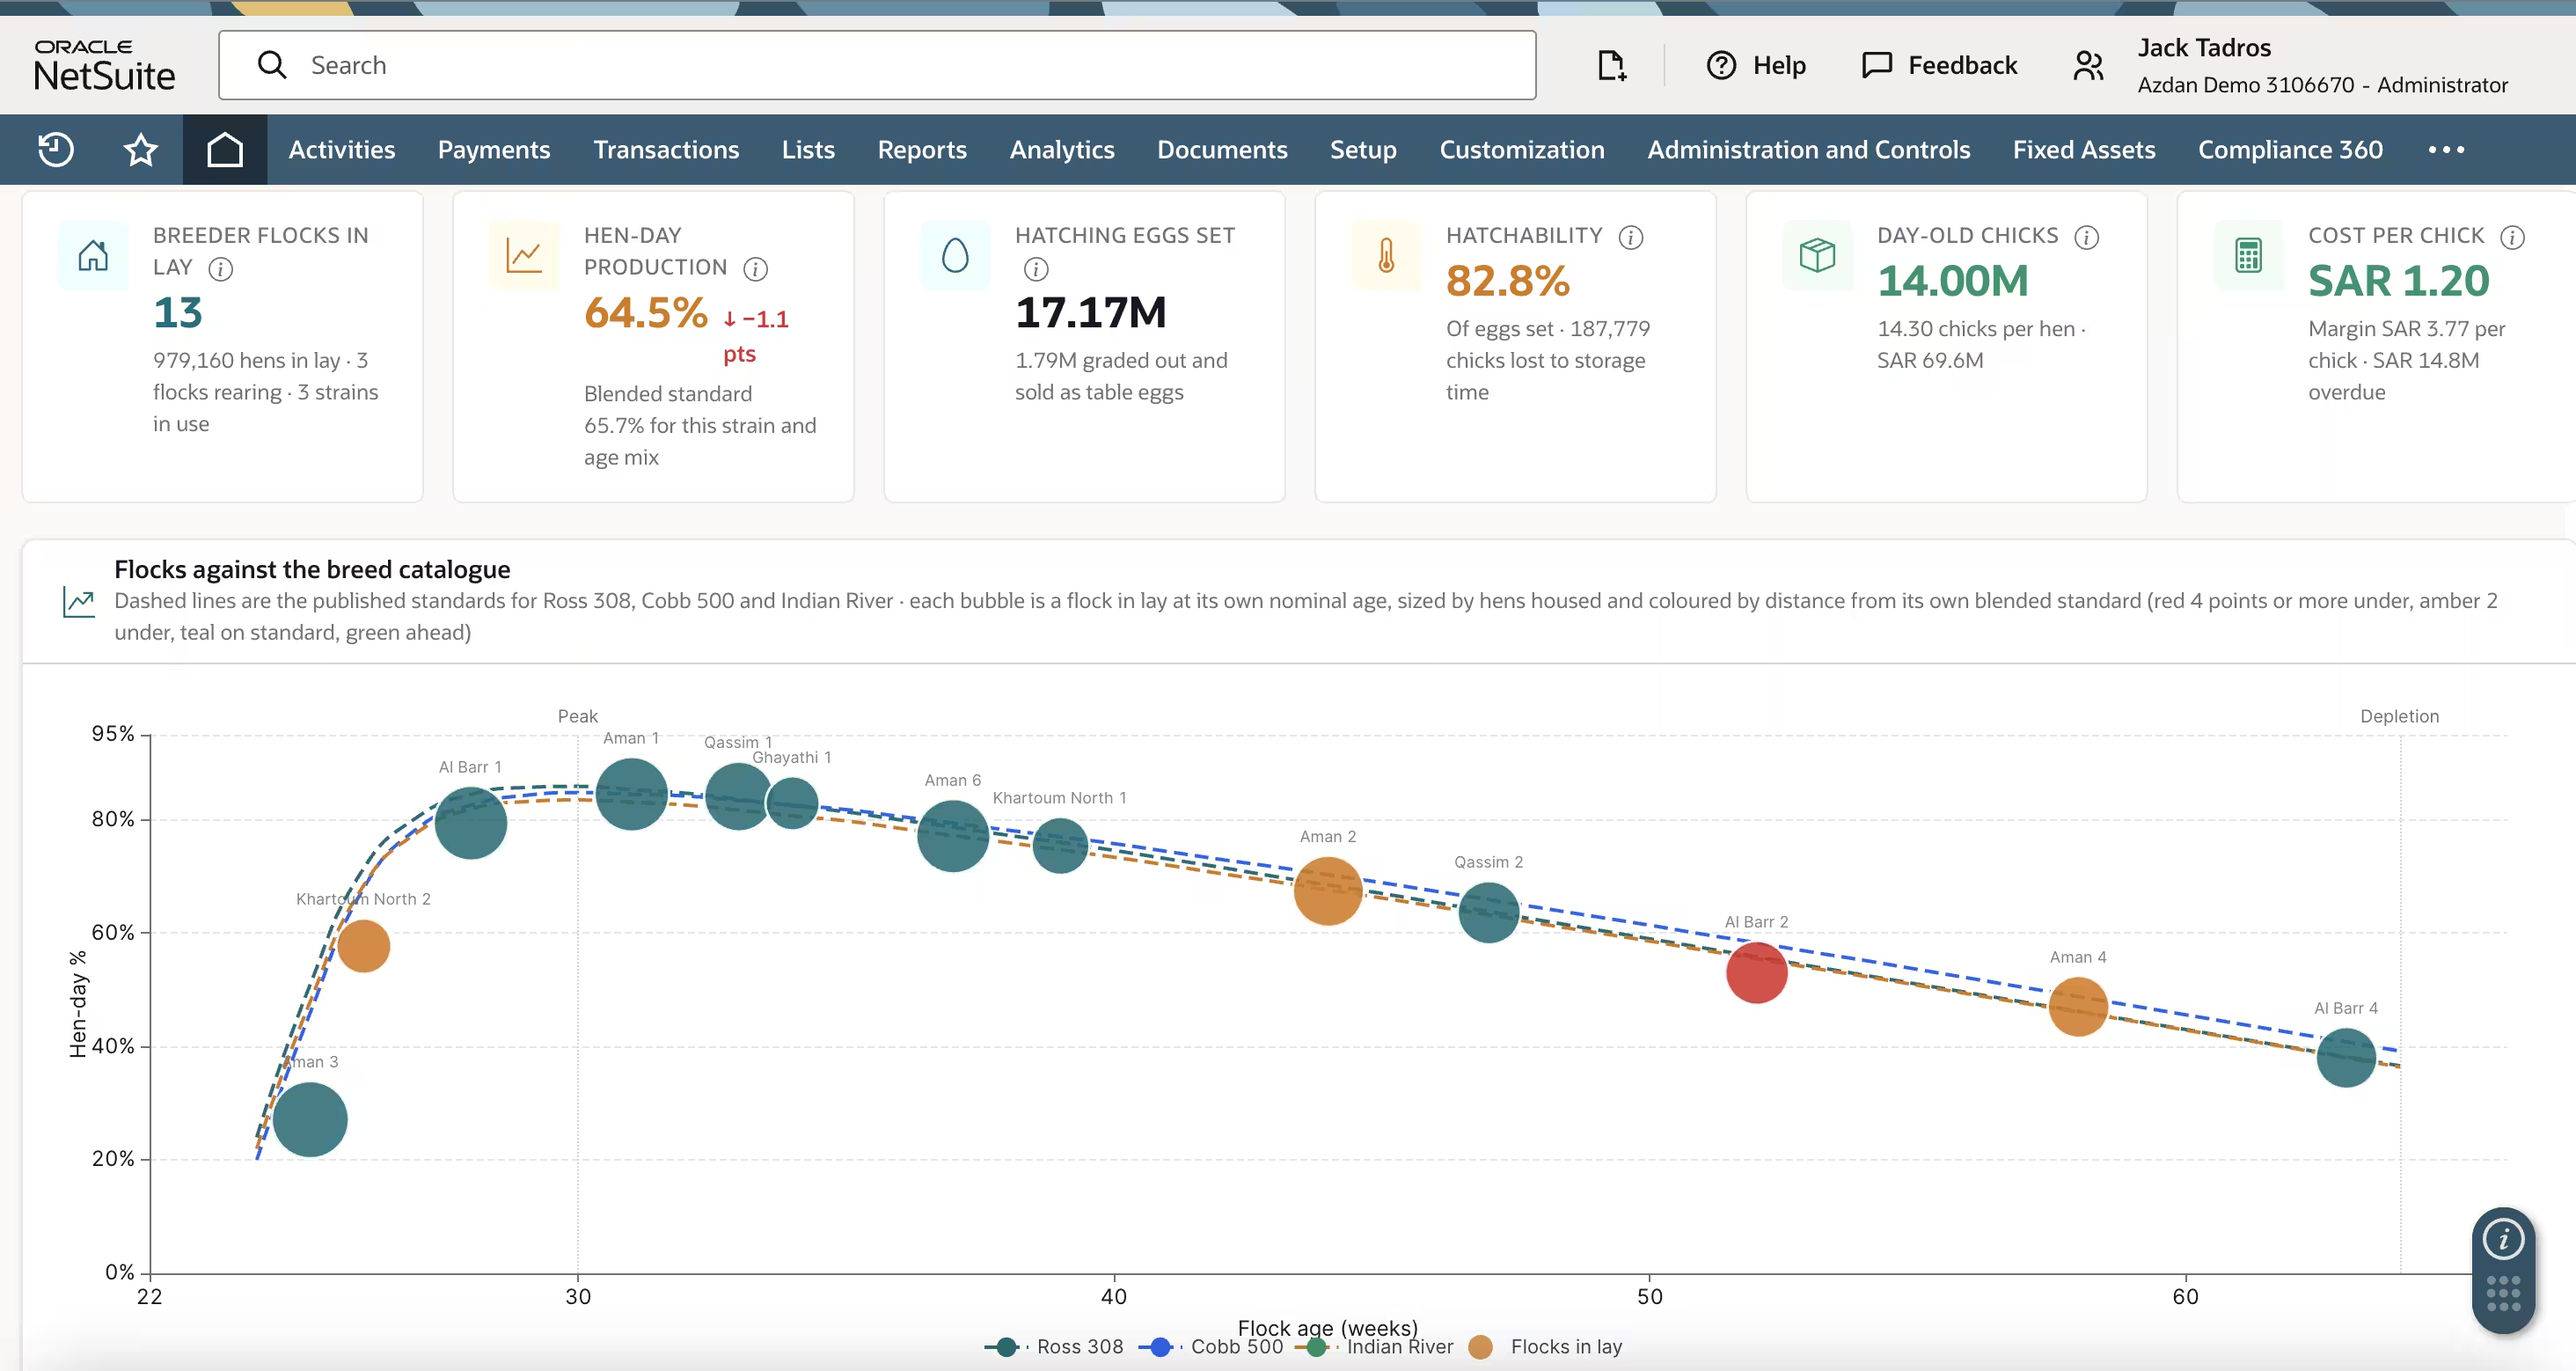
Thirteen flocks in lay, each at its own age, each against its own breed standard. Bubble size is hens housed. Colour is the gap to standard.
What a breeder ERP has to do that farm software cannot
Farm management software records the flock well. What it does not do is carry the flock as an asset. It has no capitalisation event, no depreciation schedule, no residual value and no ledger behind it. So the second largest element of chick cost is missing from every report it produces.
A breeder ERP has to close that gap. In practice that means seven things:
- Hold the flock as a cost object that production orders can charge against
- Recognise the flock as a biological asset on a controlled date
- Carry daily cost on the birds still alive, not the number placed
- Split joint outputs on relative sales value at grading and at pull
- Depreciate to the value of a spent hen rather than to zero
- Produce cost per chick from transactions, not from a model
- Consolidate across subsidiaries and currencies without a translation spreadsheet
Everything below is one of those seven, in the order the farm meets them.
What counts as a biological asset on a poultry farm?
IAS 41 uses three terms, and each is measured differently.
Biological asset. A living animal or plant. On a poultry farm, the birds.
Agricultural produce. What you harvest from it. On a breeder farm, the eggs.
Products after harvest. What you make from the produce — table eggs after packing, chicken cuts after processing. These leave IAS 41 and become inventory under IAS 2.
IAS 41 then splits biological assets in two.
Consumable assets are sold or harvested once. Broilers raised for meat are consumable, and so are chicks held for sale.
Bearer assets are kept to produce something over several periods. A dairy cow kept for milk is one. So is a breeder hen kept to lay hatching eggs.
That last point decides how your flock is measured, and it is where groups get caught out.
Is a breeder flock a bearer animal or a consumable asset?
A breeder flock is a bearer animal. It is held to produce hatching eggs across a laying life of roughly forty weeks, not to be sold for meat. The cull sale at the end is the disposal of a used asset, not the reason for holding it.
In 2014 the IASB amended IAS 41 and moved bearer plants into IAS 16, so an orchard or an oil palm can be held at cost less depreciation. That change applied to plants only. Animals stayed in IAS 41.
So a breeder hen is not treated like a fruit tree. She is treated like a dairy cow.
Fair value or cost: which basis applies?
IAS 41 requires biological assets to be measured at fair value less costs to sell, when first recognised and at each reporting date, with changes going to profit or loss.
There is one way out, and it is narrower than most people assume:
- The standard assumes fair value can be measured reliably.
- That assumption can be challenged only when the asset is first recognised.
- It can be challenged only if there is no quoted market price and other ways of estimating fair value are clearly unreliable.
- If you take that route, you hold the flock at cost less accumulated depreciation and impairment.
- If a reliable fair value becomes available later, you must switch to it.
Poultry groups often argue the rebuttal for breeder flocks, because there is no active market for a half-spent breeder hen at week 40. Nobody buys one. The only observable price is the cull price at the end of her life. That argument is common, but it is not automatic, and it is not the software vendor's call. Your auditor decides.
One point catches people even when the cost model is agreed: the exemption covers the birds, not the eggs. Agricultural produce is measured at fair value less costs to sell at the point of harvest, with no equivalent exemption. A group holding flocks at cost may still need to measure hatching eggs at fair value when they are collected, and that amount becomes their cost as inventory.
On regional standards. Egypt has its own agriculture standard, EAS 35, which follows the same model as IAS 41. It was reissued with the 2015 set of Egyptian standards and has been amended since, so check the current version before relying on it. Saudi Arabia applies IFRS as endorsed by SOCPA. The UAE applies IFRS. A group across all three is running one model with local wording, which makes it a consolidation question rather than a policy question.
What the standard needs from the farm
Whichever basis applies, the breeder ERP has to produce the same six things per flock, from the transaction record rather than a reconstruction:
- Accumulated cost from placement to the day the flock enters production
- The date it entered production, evidenced rather than remembered
- Running cost during the laying life, carried on the birds still alive
- Expected proceeds from selling the spent hens
- Volume and value of every output the flock produced
- All of the above per subsidiary, in local and group currency
Under the cost model, items 1 to 4 build the carrying amount directly. Under fair value they are still needed, to measure the movement, to support the valuation, and to answer the first question any board asks, which is whether the flock is making money.
Stage 1: Placement, and why the flock is the wrong unit of account
The textbook flock is one strain, one hatch date, one standard curve. In Egypt, Saudi Arabia and Sudan that breaks on the first order, because no single genetics agent can fill a 100,000-bird placement on the date the farm needs it.
A real flock is three consignments, two strains, two agents, hatched across an eleven-day window. The farm calls it week 31. The birds inside run from week 29 to week 31.
[IMAGE 2 — insert poultry-breeder-flock-consignments.png]
Alt text: NetSuite consignment register for a poultry breeder flock listing three consignments from two agents, each with its own strain, hatch date, true age, own breed standard and share of the flock
Each consignment keeps its own genetics, hatch date, true age and published standard, with a share of the population that weights the flock figure.
If the ERP holds one age and one standard for the whole flock, every variance report after that is wrong from the start. Production reads two points under standard when it is on standard for the birds actually in the house.
Keep the consignment as the unit of record and let the flock report against a blended standard weighted by population share. Then 84.5 per cent against a blended standard of 85.2 per cent means something.
Stage 2: Rearing, where cost accumulates
From placement to roughly week 24, the flock takes feed, vaccination, medication, labour and utilities and produces nothing saleable. Those costs sit on the balance sheet against the flock. Nothing is expensed yet.
This part is straightforward once the flock is a cost object in NetSuite that production orders can charge against. The hard part is knowing when to stop.
Stage 3: Transfer, and the date the asset is recognised
The move from rearing houses to production houses is the most important accounting event in the breeder cycle. On most farms it is recorded in a WhatsApp message.
It needs to be a controlled event, because recognising early or late shifts profit between periods. A workflow across departments does the job.
[IMAGE 3 — insert poultry-breeder-flock-transfer-capitalisation.png]
Alt text: NetSuite seven-step transfer workflow moving a poultry breeder flock from rearing to production, with four steps complete and the capitalisation step still locked
Four steps closed, floor houses in progress, finance step still red. EGP 75.8 million of rearing cost stays in work in progress until the birds are weighed and counted on arrival.
The sequence runs: production threshold reached, signed by the farm manager. Veterinary clearance. Production houses prepared. Cage houses transferred. Floor houses transferred. Weighed and counted on arrival. Only then does the finance step open and the flock is recognised.
The window has boundaries taken from the breed catalogue. It opens at week 25 and closes at week 28, and the flock has to be laying above a threshold. A flock at 27.1 per cent against a required 22.1 per cent is ready. One below it stays in rearing, and the system says so rather than leaving it to a judgement call in a monthly meeting.
Stage 4: Production, where cost follows the living birds
Housing happens once. Everything after it is a daily production order against the flock.
[IMAGE 4 — insert poultry-breeder-daily-production-orders.png]
Alt text: NetSuite daily production order entry for eleven poultry houses showing feed issued against programme, variance, water, water-to-feed ratio, temperature-adjusted expected ratio, mortality and eggs
One row per house per day. Feed, water, mortality and eggs are entered, and variance and cost re-derive as you type.
Feed, medication, vaccination and disinfectant are issued to the flock and charged to that day's order. Eggs are received against it. Mortality is entered daily.
That last field separates a real cost model from an estimate. The day's cost is carried on the birds still alive, never on the number originally placed. A flock that has lost 3.6 per cent by week 31 carries its feed bill on 94,472 hens, not the 98,000 females that arrived. Get this wrong and unit cost is understated for the whole laying life.
House-level recording also gives operations something a monthly total cannot. A house taking 1,037 kg of feed against a programme of 1,035 kg is on plan. The same house drinking 3.02 litres per kilo against a normal 3.00 looks like early disease, until you see it is running at 35.5 degrees. Adjusted for heat, the bird is drinking to plan. A flat threshold would have raised an alarm in every house in the Delta that week and taught the farm to ignore alarms.
[IMAGE 5 — insert poultry-breeder-daily-egg-collection-mortality.png]
Alt text: A month of NetSuite daily orders for one breeder flock showing hatching egg volumes, eggs graded out and a daily mortality line
The same entries read as a month. Hen-day holds near 85 per cent while daily mortality moves between twelve and thirty birds.
Stage 5: Fertility, and the cost you cannot see for 24 days
Hatchability drives the cost of every chick, and on cage houses it is driven by insemination work.
[IMAGE 6 — insert poultry-breeder-housing-occupancy-insemination.png]
Alt text: NetSuite house register showing eleven poultry houses split between floor and cage, occupancy, hens on insemination and males per 100 hens
House type sets the method. Floor houses run natural mating at 9.1 males per 100 hens. The three cage houses run artificial insemination.
Crews work a rotation, every house every five days. In one month a single subsidiary can run 117 rounds across half a million hens. Nobody knows how well the work was done until the eggs hatch, about 24 days later, so at any point most rounds cannot yet be judged.
[IMAGE 7 — insert poultry-breeder-insemination-crew-fertility.png]
Alt text: NetSuite insemination crew chart plotting four crews by hens per operator per day against fertility produced, with rounds still inside the incubation lag shown separately
Hollow points are rounds still in the incubators. Across the rounds that can be judged, the best crew sits 6.6 points above the weakest.
The best crew produced 89.8 per cent fertility. The weakest produced 83.2 per cent. Same flocks, same houses, same pace. That gap is a labour finding with a direct cost effect, and it only exists if each round is recorded as a transaction against a house, a crew and a date, then matched to hatch results a month later.
Stage 6: Eggs are agricultural produce, and the first joint split
Eggs leave the house as one pool and split into two products. Hatching eggs go to the setter. Everything graded out goes to the table egg market at a fraction of the value.
[IMAGE 8 — insert poultry-egg-grading-settable-rate.png]
Alt text: NetSuite egg grading dashboard showing total eggs, a 90.6 per cent settable rate, and grade mix by flock age from week 24 to week 40
Grade mix moves with flock age. The amber band is the small early egg, and watching it narrow is how a breeder knows a flock has come into its stride.
A young flock lays a lot of small eggs. As it matures the small-egg band narrows. As it ages, cracked and deformed eggs climb as shell quality falls. In a month with three flocks still under week 30, more than a million small early eggs came out of 18.96 million, giving a settable rate of 90.6 per cent.
The hatchery then grades the same eggs again, on purpose, because its grader has a candling machine and the farm does not. Another one per cent falls out.
Both outputs came from one flock and one feed bill, so the cost has to be split. Splitting by volume would load the table eggs with cost they cannot carry and flatter the chick. Relative sales value is the basis that holds: hatching eggs at EGP 40.32 take 99.5 per cent of the pool at EGP 8.91 each, table eggs at EGP 4.60 take 0.5 per cent at EGP 1.02 each.
[IMAGE 9 — insert poultry-joint-cost-allocation-relative-sales-value.png]
Alt text: NetSuite joint cost allocation screen showing hatching eggs against table eggs at grading, saleable chicks against culls at pull, and one bird into six cuts at the processing plant
The same rule applied three times across the group. Saleable chicks take 99.9 per cent of the hatchery pool at EGP 10.38 each; culls take the rest at EGP 0.52.
Stage 7: Hatchery yield, measured one way
Every hatchery percentage should be stated against eggs set. That is the denominator the hatchery is paid on and the only one that lets stages be compared. Stating fertility against eggs received and hatchability against fertile eggs makes each stage look better and the comparison impossible.
[IMAGE 10 — insert poultry-hatchery-yield-funnel-eggs-set.png]
Alt text: NetSuite hatchery yield funnel showing eggs set, fertile eggs at 91.1 per cent, chicks hatched at 82.8 per cent and saleable day-old chicks at 81.6 per cent of eggs set
Four stages, one denominator. The drop from hatched to saleable is the cull, and it triggers the second joint split.
- Eggs set: 17.17 million, 100 per cent
- Fertile eggs: 15.64 million, 91.1 per cent
- Chicks hatched: 14.22 million, 82.8 per cent
- Saleable day-old chicks: 14.00 million, 81.6 per cent
Stage 8: Writing the flock down to what a spent hen is worth
A hen is not written down to zero. She has a residual value: the proceeds from selling her as a spent bird, priced per kilo live.
Under the cost model, the capitalised cost is depreciated across the production orders of the laying life, down to that residual. The curve flattens onto the cull line instead of running to nil.
[IMAGE 11 — insert poultry-breeder-flock-biological-asset-depreciation.png]
Alt text: NetSuite biological asset schedule showing a poultry breeder flock capitalised at EGP 71.5 million depreciating across nine production orders down to its estimated cull value
Carrying amount across the laying life. The line flattens because the spent hen has a value, not because the schedule ran out.
A flock capitalised at EGP 71.46 million, or EGP 729.14 per hen, with a cull value of EGP 23.38 million at EGP 55.00 per kilo live, charges about EGP 5.34 million per production order across nine orders.
If the group applies fair value instead, there is no depreciation line. The flock is remeasured at each reporting date and the movement goes to profit or loss. The schedule above is then a management costing view rather than the carrying amount, which is a reporting difference, not a reason to stop producing it.
What a day-old chick costs to make
All of it resolves into one line, per flock, per period.
[IMAGE 12 — insert poultry-cost-per-day-old-chick-waterfall.png]
Alt text: NetSuite waterfall chart building the cost of one saleable day-old chick from feed, medication, vaccination, labour, utilities, overhead and flock depreciation, less the table egg credit
Feed and flock depreciation together make up about four fifths of the cost. The green step is the table egg credit coming back off the pool.
Cost of one saleable day-old chick, in EGP:
- Feed — 5.58 — 53.5%
- Flock depreciation — 2.71 — 26.0%
- Labour — 0.66 — 6.3%
- Overhead — 0.54 — 5.2%
- Utilities — 0.41 — 3.9%
- Medication — 0.31 — 3.0%
- Vaccination — 0.23 — 2.2%
- Table egg credit — (0.22)
- Cost per saleable chick — 10.22
Note what sits second. Flock depreciation is a quarter of the cost of a chick, and it is the one element farm software cannot produce, because it depends on an asset that software does not carry.
[IMAGE 13 — insert poultry-feed-mill-raw-material-cost-per-tonne.png]
Alt text: NetSuite feed mill screen showing the cost contribution of each raw material to a tonne of poultry feed, imported against domestic, and the effect of a price change on cost per chick
Yellow corn and soya bean meal dominate a tonne of feed, and both are imported across most of the region. A price change re-derives cost and margin for every flock in the country.
[IMAGE 14 — insert poultry-group-production-by-farm-and-site.png]
Alt text: NetSuite group dashboard showing poultry production by farm and site as a treemap sized by chicks produced and coloured by performance against breed catalogue
At group level the same model consolidates across subsidiaries and currencies, so a weak site shows up before the variance report does.
Using the same records to plan forward
The flock book has a second use. Each flock in lay can be walked forward along its own breed curve and depleted at week 64, which gives physical hatch capacity by month for the next six months.
[IMAGE 15 — insert poultry-chick-supply-outlook-vs-order-book.png]
Alt text: NetSuite chart showing six months of hatchable chick capacity by country as stacked bars, with the contracted order book line rising above the bars in later months
Bars are what the flock book can physically hatch. The line is what has already been sold. Where the line clears the bars, the order book is committed beyond supply.
When the shortfall arrives, allocation becomes a daily decision.
[IMAGE 16 — insert poultry-chick-order-book-allocation.png]
Alt text: NetSuite chick allocation screen showing a day's hatch allocated customer by customer in priority order, with one part-allocated order and two customers receiving nothing
Orders fill in priority order until the hatch runs out. Faded bars are volume a customer contracted for and will not receive.
Common questions
What is a breeder ERP?
Software that records breeder farm operations — placement, feed, mortality, insemination, egg collection and grading — and posts them to the general ledger, so the flock is carried as an asset and every output has a cost. Farm management software does the first half. A breeder ERP does both.
Can NetSuite handle poultry breeder management?
NetSuite does not ship with a poultry module. What it does provide is the ledger, multi-subsidiary consolidation, multi-currency, work orders and inventory to build on. The breeder-specific parts — flock and consignment records, the transfer workflow, breed catalogues, joint cost allocation and the biological asset schedule — are configured and extended on top of that.
Is a breeder flock a fixed asset or a biological asset?
A biological asset under IAS 41, not a fixed asset under IAS 16. The 2014 amendment that moved bearer plants into IAS 16 applied to plants only, so bearer animals such as breeder hens and dairy cattle stayed in IAS 41.
Can a breeder flock be held at cost instead of fair value?
Only if fair value cannot be measured reliably, and only if that is established when the flock is first recognised. There must be no quoted market price and other estimates must be clearly unreliable. If a reliable fair value becomes available later, the flock has to be remeasured. It is an exception, not a policy choice.
How are broilers treated differently from breeders in an ERP?
Broilers are consumable biological assets, raised and sold rather than held to produce over several periods. They stay in IAS 41 until slaughter, then the meat becomes inventory under IAS 2. No capitalisation event and no depreciation schedule, which makes broiler costing considerably simpler than breeder costing.
When are hatching eggs no longer a biological asset?
At the point of harvest. Agricultural produce is measured at fair value less costs to sell when collected, and that amount becomes its cost as inventory from then on.
How should joint costs be split between hatching eggs and table eggs?
On relative sales value, not volume. Both come from one pool and one cost base but sell at very different prices, so splitting by count loads the low-value output with cost it cannot carry.
What is the residual value of a breeder hen?
The expected proceeds from selling her as a spent bird, usually priced per kilo live weight. Under the cost model, the flock depreciates down to that figure rather than to zero.
Azdan is an Oracle NetSuite solution provider working with agribusiness and protein groups in Egypt, Saudi Arabia, the UAE and Jordan. The screens above come from a NetSuite breeder ERP configuration covering breeder, hatchery and feed mill operations. This article is general guidance and not accounting advice; the measurement basis for your flocks is a matter for your auditor.